HP 30b HP 20b Business Consultant and HP 30b Business Professional User's Guid - Page 35
Time Value of Money, Time Value of Money (TVM) Keys - financial calculator
 |
View all HP 30b manuals
Add to My Manuals
Save this manual to your list of manuals |
Page 35 highlights
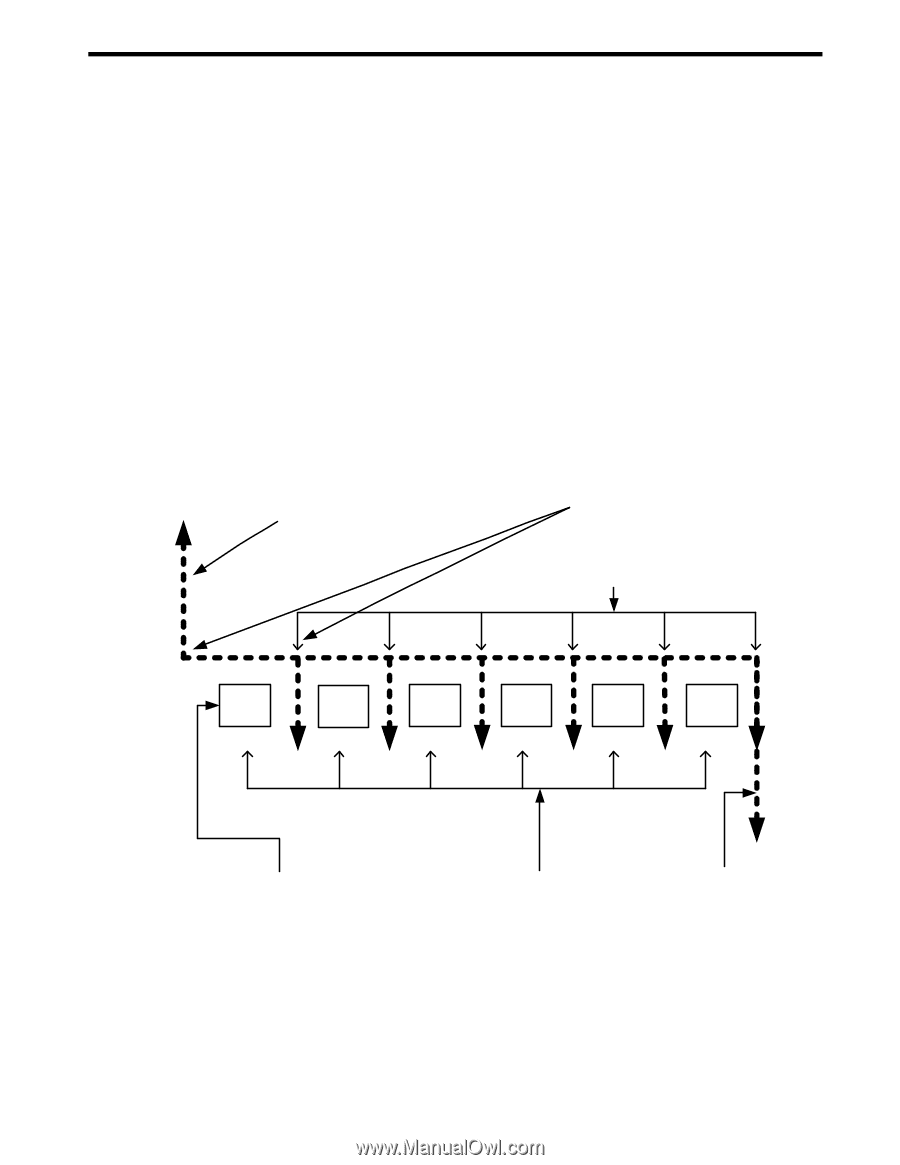
3 Time Value of Money The examples in the following sections are calculated with the Mode menu preferences in their default settings, unless otherwise noted. For more information about basic features and setting preferences, see Chapter 1, Basic Features. Time Value of Money (TVM) Keys Cash flow diagrams are useful tools for analyzing financial situations, as they help you identify the TVM functions needed to resolve your problem. A cash flow diagram is a drawing with a set of vertical arrows arranged on a horizontal line. The horizontal line represents the period of time from the beginning of the financing to the end. The vertical arrows represent the money or cash flows at certain times throughout the period. The arrows' length is proportional to the cash flow amount each arrow represents; a longer arrow indicates a larger amount, a shorter arrow, a smaller amount. Each arrow's position on the line represents the time at which the cash flow occurs. The orientation of the arrow, up or down, represents the "direction" of the cash flow: up for money received, down for money paid out. See Figure 1. (PV) Loan amountmoney received is positive (Beg) (End) For payments occurring at the beginning or end of the compounding period Q (P/YR) Payments per year PMT 1 PMT 2 PMT 3 PMT 4 PMT 5 PMT 6 (PMT) Amount paid out in equal payments at regular intervals (N) Number of payments or compounding periods (FV) Final loan value (if any) Figure 1 Cash Flow Diagram Example with Corresponding TVM Keys The TVM functions of the calculator can solve problems with at least one cash flow, and problems in which all the cash flows, except the first and last, are of the same value. To solve other types of cash flows, refer to Chapter 4, Canadian Mortgages: TVM Canada, or Chapter 5, Cash Flows. Time Value of Money 27
-
 1
1 -
2
-
3
-
4
-
5
-
6
-
7
-
8
-
9
-
10
-
11
-
12
-
13
-
14
-
15
-
16
-
17
-
18
-
19
-
20
-
21
-
22
-
23
-
24
-
25
-
26
-
27
-
28
-
29
-
 30
30 -
 31
31 -
 32
32 -
 33
33 -
 34
34 -
 35
35 -
 36
36 -
 37
37 -
 38
38 -
 39
39 -
 40
40 -
41
-
42
-
43
-
44
-
45
-
46
-
47
-
48
-
49
-
50
-
51
-
52
-
53
-
54
-
55
-
56
-
57
-
58
-
59
-
60
-
61
-
62
-
63
-
64
-
65
-
66
-
67
-
68
-
69
-
70
-
71
-
72
-
73
-
74
-
75
-
76
-
77
-
78
-
79
-
80
-
81
-
82
-
83
-
84
-
85
-
86
-
87
-
88
-
89
-
90
-
91
-
92
-
93
-
94
-
95
-
96
-
97
-
98
-
99
-
100
-
101
-
102
-
103
-
104
-
105
-
106
-
107
-
108
-
109
-
110
-
111
-
112
-
113
-
114
 |
 |