HP 40g hp 39g & 40g_user's manual_English_E_pdfbpia5212.pdf - Page 60
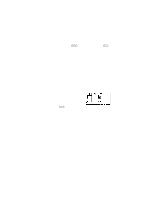
Example: plotting a circle
 |
View all HP 40g manuals
Add to My Manuals
Save this manual to your list of manuals |
Page 60 highlights
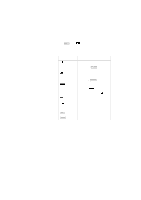
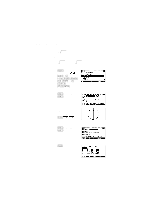
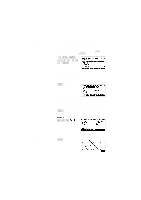
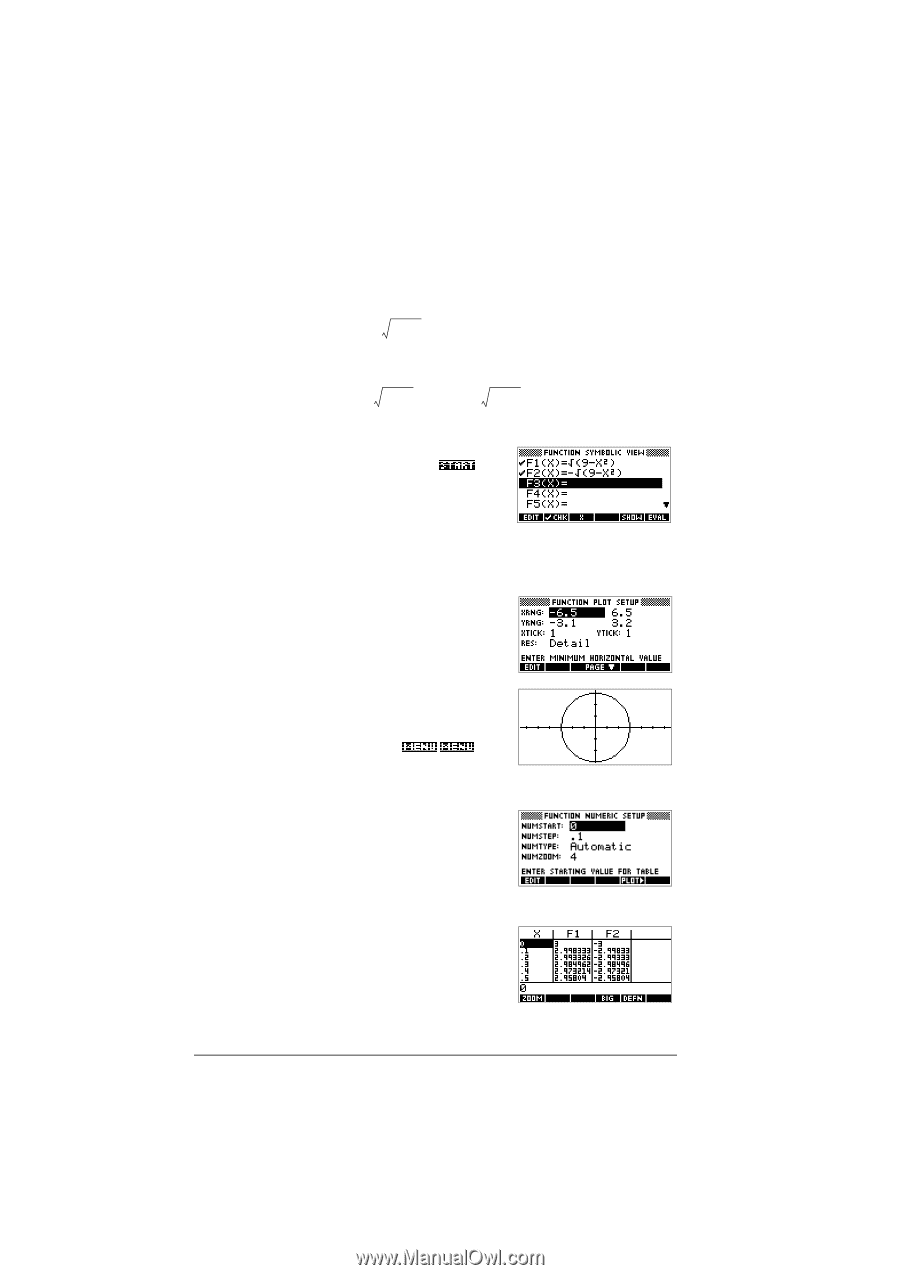
Example: plotting a circle Plot the circle, x2+ y2 = 9. First rearrange it to read y = ± 9 - x2 . To plot both the positive and negative y values, you need to define two equations as follows: y = 9 - x2 and y = - 9 - x2 1. In the Function aplet, specify the functions. Select Function √9 √9 2. Reset the graph setup to the default settings. SETUP-PLOT CLEAR 3. Plot the two functions and hide the menu so that you can see all the circle. 4. Reset the numeric setup to the default settings. SETUP-NUM CLEAR 5. Display the functions in numeric form. 2-20 Aplets and their views
-
 1
1 -
2
-
3
-
4
-
5
-
6
-
7
-
8
-
9
-
10
-
11
-
12
-
13
-
14
-
15
-
16
-
17
-
18
-
19
-
20
-
21
-
22
-
23
-
24
-
25
-
26
-
27
-
28
-
29
-
30
-
31
-
32
-
33
-
34
-
35
-
36
-
37
-
38
-
39
-
40
-
41
-
42
-
43
-
44
-
45
-
46
-
47
-
48
-
49
-
50
-
51
-
52
-
53
-
54
-
 55
55 -
 56
56 -
 57
57 -
 58
58 -
 59
59 -
 60
60 -
 61
61 -
 62
62 -
 63
63 -
 64
64 -
 65
65 -
66
-
67
-
68
-
69
-
70
-
71
-
72
-
73
-
74
-
75
-
76
-
77
-
78
-
79
-
80
-
81
-
82
-
83
-
84
-
85
-
86
-
87
-
88
-
89
-
90
-
91
-
92
-
93
-
94
-
95
-
96
-
97
-
98
-
99
-
100
-
101
-
102
-
103
-
104
-
105
-
106
-
107
-
108
-
109
-
110
-
111
-
112
-
113
-
114
-
115
-
116
-
117
-
118
-
119
-
120
-
121
-
122
-
123
-
124
-
125
-
126
-
127
-
128
-
129
-
130
-
131
-
132
-
133
-
134
-
135
-
136
-
137
-
138
-
139
-
140
-
141
-
142
-
143
-
144
-
145
-
146
-
147
-
148
-
149
-
150
-
151
-
152
-
153
-
154
-
155
-
156
-
157
-
158
-
159
-
160
-
161
-
162
-
163
-
164
-
165
-
166
-
167
-
168
-
169
-
170
-
171
-
172
-
173
-
174
-
175
-
176
-
177
-
178
-
179
-
180
-
181
-
182
-
183
-
184
-
185
-
186
-
187
-
188
-
189
-
190
-
191
-
192
-
193
-
194
-
195
-
196
-
197
-
198
-
199
-
200
-
201
-
202
-
203
-
204
-
205
-
206
-
207
-
208
-
209
-
210
-
211
-
212
-
213
-
214
-
215
-
216
-
217
-
218
-
219
-
220
-
221
-
222
-
223
-
224
-
225
-
226
-
227
-
228
-
229
-
230
-
231
-
232
-
233
-
234
-
235
-
236
-
237
-
238
-
239
-
240
-
241
-
242
-
243
-
244
-
245
-
246
-
247
-
248
-
249
-
250
-
251
-
252
-
253
-
254
-
255
-
256
-
257
-
258
-
259
-
260
-
261
-
262
-
263
-
264
-
265
-
266
-
267
-
268
-
269
-
270
-
271
-
272
-
273
-
274
-
275
-
276
-
277
-
278
-
279
-
280
-
281
-
282
-
283
-
284
-
285
-
286
-
287
-
288
 |
 |
2-20
Aplets and their views
Example: plotting a circle
Plot the circle,
x
2
+ y
2
=
9
.
First rearrange it to read
.
To plot both the positive and negative
y
values, you need to
define two equations as follows:
and
1.
In the Function aplet, specify the functions.
>$3/(7@
Select
Function
>6+,)7@
√
¶>³@
9
>²@>;µ7µ
5
@>;
²
@>´@>(17(5@
>³²´@¶>6+,)7@
√
¶>³@
9
>²@>;µ7µ
5
@
>;
²
@>´@>(17(5@
2.
Reset the graph setup to the default settings.
>6+,)7@
SETUP
-
PLOT
>6+,)7@
CLEAR
3.
Plot the two functions
and hide the menu so that
you can see all the circle.
>3/27@
4.
Reset the numeric setup to the default settings.
>6+,)7@
SETUP
-
NUM
>6+,)7@
CLEAR
5.
Display the functions in numeric form.
>180@
y
9
x
2
–
±
=
y
9
x
2
–
=
y
9
x
2
–
–
=