HP 50g HP 50g_user's manual_English_HDPSG49AEM8.pdf - Page 127
Plotting an expression of the form y = f(x
 |
UPC - 882780502291
View all HP 50g manuals
Add to My Manuals
Save this manual to your list of manuals |
Page 127 highlights
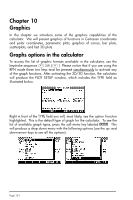
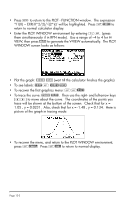
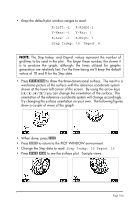
Plotting an expression of the form y = f(x) As an example, let's plot the function, f (x) = 1 exp(− x2 ) 2π 2 • First, enter the PLOT SETUP environment by pressing, „ô. Make sure that the option Function is selected as the TYPE, and that 'X' is selected as the independent variable (INDEP). Press L@@@OK@@@ to return to normal calculator display. The PLOT SET UP window should look similar to this: • Enter the PLOT environment by pressing „ñ(press them simultaneously if in RPN mode). Press @ADD to get you into the equation writer. You will be prompted to fill the right-hand side of an equation Y1(x) = . Type the function to be plotted so that the Equation Writer shows the following: Page 10-2
-
 1
1 -
2
-
3
-
4
-
5
-
6
-
7
-
8
-
9
-
10
-
11
-
12
-
13
-
14
-
15
-
16
-
17
-
18
-
19
-
20
-
21
-
22
-
23
-
24
-
25
-
26
-
27
-
28
-
29
-
30
-
31
-
32
-
33
-
34
-
35
-
36
-
37
-
38
-
39
-
40
-
41
-
42
-
43
-
44
-
45
-
46
-
47
-
48
-
49
-
50
-
51
-
52
-
53
-
54
-
55
-
56
-
57
-
58
-
59
-
60
-
61
-
62
-
63
-
64
-
65
-
66
-
67
-
68
-
69
-
70
-
71
-
72
-
73
-
74
-
75
-
76
-
77
-
78
-
79
-
80
-
81
-
82
-
83
-
84
-
85
-
86
-
87
-
88
-
89
-
90
-
91
-
92
-
93
-
94
-
95
-
96
-
97
-
98
-
99
-
100
-
101
-
102
-
103
-
104
-
105
-
106
-
107
-
108
-
109
-
110
-
111
-
112
-
113
-
114
-
115
-
116
-
117
-
118
-
119
-
120
-
121
-
 122
122 -
 123
123 -
 124
124 -
 125
125 -
 126
126 -
 127
127 -
 128
128 -
 129
129 -
 130
130 -
 131
131 -
 132
132 -
133
-
134
-
135
-
136
-
137
-
138
-
139
-
140
-
141
-
142
-
143
-
144
-
145
-
146
-
147
-
148
-
149
-
150
-
151
-
152
-
153
-
154
-
155
-
156
-
157
-
158
-
159
-
160
-
161
-
162
-
163
-
164
-
165
-
166
-
167
-
168
-
169
-
170
-
171
-
172
-
173
-
174
-
175
-
176
-
177
-
178
-
179
-
180
-
181
-
182
-
183
-
184
 |
 |

Page 10-2
Plotting an expression of the form y = f(x)
As an example, let's plot the function,
•
First, enter the PLOT SETUP environment by pressing,
„ô
.
Make
sure that the option Function is selected as the
TYPE
, and that
‘X’ is
selected as the independent variable (
INDEP
).
Press
L
@@@OK@@@
to
return to normal calculator display.
The PLOT SET UP window should
look similar to this:
•
Enter the PLOT environment by pressing
„ñ
(press them
simultaneously if in RPN mode).
Press
@ADD
to get you into the equation
writer.
You will be prompted to fill the right-hand side of an equation
Y1(x) =
±
.
Type the function to be plotted so that the Equation Writer
shows the following:
)
2
exp(
2
1
)
(
2
x
x
f
−
=
π