HP 9g hp 9g_user's manual_English_E_HDP1SG18ES1.pdf - Page 19
Graphs - user manual
 |
View all HP 9g manuals
Add to My Manuals
Save this manual to your list of manuals |
Page 19 highlights
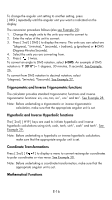
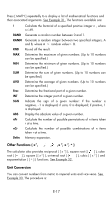
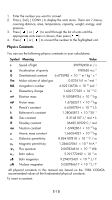
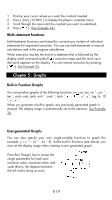
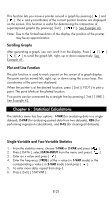
1. Position your cursor where you want the constant inserted. 2. Press [ 2nd ] [ CONST ] to display the physics constants menu. 3. Scroll through the menu until the constant you want is underlined. 4. Press [ ]. (See Example 34.) Multi-statement functions Multi-statement functions are formed by connecting a number of individual statements for sequential execution. You can use multi-statements in manual calculations and in the program calculations. When execution reaches the end of a statement that is followed by the display result command symbol ( ), execution stops and the result up to that point appears on the display. You can resume execution by pressing [ ]. See Example 35. Chapter 5 : Graphs Built-in Function Graphs You can produce graphs of the following functions: sin, cos, tan, sin -1, cos -1, tan -1, sinh, cosh, tanh, sinh -1, cosh -1, tanh -1, , , x 2 , x 3 , log, ln, 10 x, e x, x -1. When you generate a built-in graph, any previously generated graph is cleared. The display range is automatically set to the optimum. See Example 36. User-generated Graphs You can also specify your own single-variable functions to graph (for example, y = x 3 + 3x 2 - 6x - 8). Unlike built-in functions (see above), you must set the display range when creating a user generated graph. Press the [ Range ] key to access the range parameters for each axis: minimum value, maximum value, and scale (that is, the distance between the tick marks along an axis). E-19
-
 1
1 -
2
-
3
-
4
-
5
-
6
-
7
-
8
-
9
-
10
-
11
-
12
-
13
-
 14
14 -
 15
15 -
 16
16 -
 17
17 -
 18
18 -
 19
19 -
 20
20 -
 21
21 -
 22
22 -
 23
23 -
 24
24 -
25
-
26
-
27
-
28
-
29
-
30
-
31
-
32
-
33
-
34
-
35
-
36
-
37
-
38
-
39
-
40
-
41
-
42
-
43
-
44
-
45
-
46
-
47
-
48
-
49
-
50
-
51
-
52
-
53
-
54
-
55
-
56
-
57
-
58
-
59
-
60
-
61
-
62
-
63
-
64
-
65
-
66
-
67
-
68
-
69
-
70
-
71
-
72
-
73
-
74
-
75
-
76
-
77
-
78
-
79
-
80
-
81
-
82
-
83
-
84
-
85
-
86
-
87
 |
 |