HP 9g hp 9g_user's manual_English_E_HDP1SG18ES1.pdf - Page 22
Process Capability
 |
View all HP 9g manuals
Add to My Manuals
Save this manual to your list of manuals |
Page 22 highlights
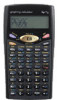
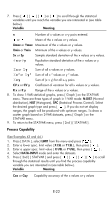
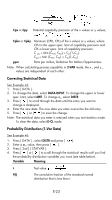
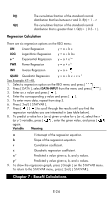
7. Press or [ ] to scroll through the statistical variables until you reach the variable you are interested in (see table below). Variable Meaning n Number of x values or x-y pairs entered. or Mean of the x values or y values. Xmax or Ymax Maximum of the x values or y values. Xmin or Ymin Minimum of the x values or y values. Sx or Sy Sample standard deviation of the x values or y values. σx orσy Population standard deviation of the x values or y values. Σx or Σy Sum of all x values or y values. Σx 2 or Σy 2 Sum of all x 2 values or y 2 values. Σx y Sum of (x × y) for all x-y pairs. CV x or CV y Coefficient of variation for all x values or y values. R x or R y Range of the x values or y values. 8. To draw 1-VAR statistical graphs, press [ Graph ] on the STATVAR menu. There are three types of graph in 1-VAR mode: N-DIST (Normal distribution), HIST (Histogram), SPC (Statistical Process Control). Select the desired graph type and press [ ]. If you do not set display ranges, the graph will be produced with optimum ranges. To draw a scatter graph based on 2-VAR datasets, press [ Graph ] on the STATVAR menu. 9. To return to the STATVAR menu, press [ 2nd ] [ STATVAR ]. Process Capability (See Examples 43 and 44.) 1. Press [ DATA ], select LIMIT from the menu and press [ ]. 2. Enter a lower spec. limit value ( X LSL or Y LSL ), then press [ ]. 3. Enter a upper spec. limit value ( X USL or Y USL), then press [ ] . 4. Select DATA-INPUT mode and enter the datasets. 5. Press [ 2nd ] [ STATVAR ] and press to scroll through the statistical results until you find the process capability variable you are interested in (see table below). Variable Meaning Cax or Cay Capability accuracy of the x values or y values E-22
-
 1
1 -
2
-
3
-
4
-
5
-
6
-
7
-
8
-
9
-
10
-
11
-
12
-
13
-
14
-
15
-
16
-
 17
17 -
 18
18 -
 19
19 -
 20
20 -
 21
21 -
 22
22 -
 23
23 -
 24
24 -
 25
25 -
 26
26 -
 27
27 -
28
-
29
-
30
-
31
-
32
-
33
-
34
-
35
-
36
-
37
-
38
-
39
-
40
-
41
-
42
-
43
-
44
-
45
-
46
-
47
-
48
-
49
-
50
-
51
-
52
-
53
-
54
-
55
-
56
-
57
-
58
-
59
-
60
-
61
-
62
-
63
-
64
-
65
-
66
-
67
-
68
-
69
-
70
-
71
-
72
-
73
-
74
-
75
-
76
-
77
-
78
-
79
-
80
-
81
-
82
-
83
-
84
-
85
-
86
-
87
 |
 |
