HP 9g hp 9g_user's manual_English_E_HDP1SG18ES1.pdf - Page 21
Statistical Calculations - how to use a graphing calculator
 |
View all HP 9g manuals
Add to My Manuals
Save this manual to your list of manuals |
Page 21 highlights
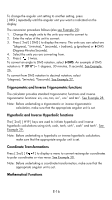
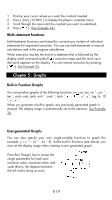
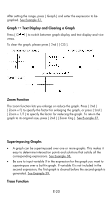
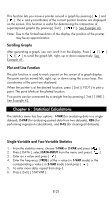
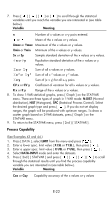
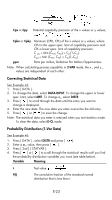
This function lets you move a pointer around a graph by pressing [ ] and [ ]. The x- and y-coordinates of the current pointer location are displayed on the screen. This function is useful for determining the intersection of superimposed graphs (by pressing [ 2nd ] [ X Y ]). See Example 40. Note: Due to the limited resolution of the display, the position of the pointer may be an approximation. Scrolling Graphs After generating a graph, you can scroll it on the display. Press to scroll the graph left, right, up or down respectively. See Example 41. Plot and Line Function The plot function is used to mark a point on the screen of a graph display. The point can be moved left, right, up, or down using the cursor keys. The coordinates of the point are displayed. When the pointer is at the desired location, press [ 2nd ] [ PLOT ] to plot a point. The point blinks at the plotted location. Two points can be connected by a straight line by pressing [ 2nd ] [ LINE ]. See Example 42. Chapter 6 : Statistical Calculations The statistics menu has four options: 1-VAR (for analyzing data in a single dataset), 2-VAR (for analyzing paired data from two datasets), REG (for performing regression calculations), and D-CL (for clearing all datasets). Single-Variable and Two-Variable Statistics 1. From the statistics menu, choose 1-VAR or 2-VAR and press [ ]. 2. Press [ DATA ], select DATA-INPUT from the menu and press [ ]. 3. Enter an x value and press [ ]. 4. Enter the frequency ( FREQ ) of the x value (in 1-VAR mode) or the corresponding y value ( in 2-VAR mode ) and press [ ]. 5. To enter more data, repeat from step 3. 6. Press [ 2nd ] [ STATVAR ]. E-21
-
 1
1 -
2
-
3
-
4
-
5
-
6
-
7
-
8
-
9
-
10
-
11
-
12
-
13
-
14
-
15
-
 16
16 -
 17
17 -
 18
18 -
 19
19 -
 20
20 -
 21
21 -
 22
22 -
 23
23 -
 24
24 -
 25
25 -
 26
26 -
27
-
28
-
29
-
30
-
31
-
32
-
33
-
34
-
35
-
36
-
37
-
38
-
39
-
40
-
41
-
42
-
43
-
44
-
45
-
46
-
47
-
48
-
49
-
50
-
51
-
52
-
53
-
54
-
55
-
56
-
57
-
58
-
59
-
60
-
61
-
62
-
63
-
64
-
65
-
66
-
67
-
68
-
69
-
70
-
71
-
72
-
73
-
74
-
75
-
76
-
77
-
78
-
79
-
80
-
81
-
82
-
83
-
84
-
85
-
86
-
87
 |
 |