HP ML150 HP Power Capping and Dynamic Power Capping for ProLiant servers techn - Page 19
Power capping to peak power consumption - g5
 |
UPC - 884420743644
View all HP ML150 manuals
Add to My Manuals
Save this manual to your list of manuals |
Page 19 highlights
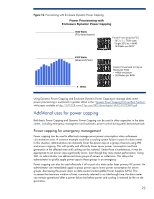
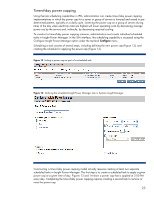
Continuing with this example, Figure 11 shows the IPM Group Power Consumption graph for the group of eight servers running a typical variable load application. IPM generates this graph using data collected from each server's power management system. The power management system measures power consumption two times per second and records both the peak and average power consumption. For peak power consumption, each point in the graph represents the highest half-second power measurement recorded during a given five-minute period. The average power consumption denotes the arithmetic mean of all half-second power measurements recorded over the same timeframe. Figure 11. Group Power Consumption graph for a group of eight ProLiant DL380 G5 servers The peak power consumption for the server group running this particular workload is about 3116 watts, and the average power consumption is about 1900 watts. Knowing the peak and average power consumption history for the group provides a good starting point for deciding how to set effective power caps that meet different power management objectives in the data center. Power capping to peak power consumption As the power consumption graph in Figure 10 shows, peak power consumption for the eight-server group running this workload is consistently about 3116 watts. Setting a power cap at this level would have no impact on overall server performance but would ensure that the server group's power consumption will not exceed 3116 watts for any significant period of time. For basic Power Capping, cooling requirements for the server group could then be safely budgeted against 3116 watts of power consumed rather than against the larger maximum power number of 3384 watts that the HP Power 19
-
 1
1 -
2
-
3
-
4
-
5
-
6
-
7
-
8
-
9
-
10
-
11
-
12
-
13
-
 14
14 -
 15
15 -
 16
16 -
 17
17 -
 18
18 -
 19
19 -
 20
20 -
 21
21 -
 22
22 -
 23
23 -
 24
24 -
25
-
26
 |
 |
