Netgear FVS114 FVS114 Reference Manual - Page 120
Show Statistics, Router Statistics screen, Table 7-1., Connection Status action buttons - bandwidth
 |
UPC - 606449040494
View all Netgear FVS114 manuals
Add to My Manuals
Save this manual to your list of manuals |
Page 120 highlights
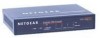
Reference Manual for the ProSafe VPN Firewall FVS114 Click Show Statistics to display firewall usage statistics. Figure 7-3: Router Statistics screen This screen shows the following statistics: Table 7-1. Field Interface Status TxPkts RxPkts Collisions Tx B/s Rx B/s Up Time Poll Interval Router Statistics fields Description The statistics for the WAN (Internet), LAN (local), 802.11a, and 802.11b/g interfaces. For each interface, the screen displays: The link status of the interface. The number of packets transmitted on this interface since reset or manual clear. The number of packets received on this interface since reset or manual clear. The number of collisions on this interface since reset or manual clear. The current transmission (outbound) bandwidth used on the interfaces. The current reception (inbound) bandwidth used on the interfaces. The time elapsed since this port acquired the link. Specifies the intervals at which the statistics are updated in this window. Click on Stop to freeze the display. WAN Status action buttons are described in the table below: Table 7-2. Field Set Interval Stop Connection Status action buttons Description Enter a time and click the button to set the polling frequency. Click the Stop button to freeze the polling information. 7-4 Maintenance 202-10098-01, April 2005
-
 1
1 -
2
-
3
-
4
-
5
-
6
-
7
-
8
-
9
-
10
-
11
-
12
-
13
-
14
-
15
-
16
-
17
-
18
-
19
-
20
-
21
-
22
-
23
-
24
-
25
-
26
-
27
-
28
-
29
-
30
-
31
-
32
-
33
-
34
-
35
-
36
-
37
-
38
-
39
-
40
-
41
-
42
-
43
-
44
-
45
-
46
-
47
-
48
-
49
-
50
-
51
-
52
-
53
-
54
-
55
-
56
-
57
-
58
-
59
-
60
-
61
-
62
-
63
-
64
-
65
-
66
-
67
-
68
-
69
-
70
-
71
-
72
-
73
-
74
-
75
-
76
-
77
-
78
-
79
-
80
-
81
-
82
-
83
-
84
-
85
-
86
-
87
-
88
-
89
-
90
-
91
-
92
-
93
-
94
-
95
-
96
-
97
-
98
-
99
-
100
-
101
-
102
-
103
-
104
-
105
-
106
-
107
-
108
-
109
-
110
-
111
-
112
-
113
-
114
-
 115
115 -
 116
116 -
 117
117 -
 118
118 -
 119
119 -
 120
120 -
 121
121 -
 122
122 -
 123
123 -
 124
124 -
 125
125 -
126
-
127
-
128
-
129
-
130
-
131
-
132
-
133
-
134
-
135
-
136
-
137
-
138
-
139
-
140
-
141
-
142
-
143
-
144
-
145
-
146
-
147
-
148
-
149
-
150
-
151
-
152
-
153
-
154
-
155
-
156
-
157
-
158
-
159
-
160
-
161
-
162
-
163
-
164
-
165
-
166
-
167
-
168
-
169
-
170
-
171
-
172
-
173
-
174
-
175
-
176
-
177
-
178
-
179
-
180
-
181
-
182
-
183
-
184
-
185
-
186
-
187
-
188
-
189
-
190
-
191
-
192
-
193
-
194
-
195
-
196
-
197
-
198
-
199
-
200
-
201
-
202
-
203
-
204
-
205
-
206
-
207
-
208
-
209
-
210
-
211
-
212
 |
 |
