Netgear FWAG114 FWAG114 Reference Manual - Page 68
Router Statistics screen, Table 6-1., Router Statistics Fields
 |
UPC - 606449026955
View all Netgear FWAG114 manuals
Add to My Manuals
Save this manual to your list of manuals |
Page 68 highlights
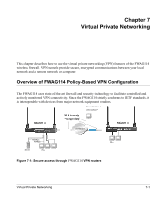
Reference Manual for the ProSafe Dual Band Wireless VPN Firewall FWAG114 Click "Show Statistics" to display router usage statistics. Figure 6-3: Router Statistics screen This screen shows the following statistics: Table 6-1. Router Statistics Fields Field interface Status TxPkts RxPkts Collisions Tx B/s Rx B/s Up Time Up Time Poll Interval Description The statistics for the WAN (Internet), LAN (local), 802.11a, and 802.11b/g interfaces. For each interface, the screen displays: The link status of the interface. The number of packets transmitted on this interface since reset or manual clear. The number of packets received on this interface since reset or manual clear. The number of collisions on this interface since reset or manual clear. The current transmission (outbound) bandwidth used on the interfaces. The current reception (inbound) bandwidth used on the interfaces. The amount of time since the router was last restarted. The time elapsed since this port acquired the link. Specifies the intervals at which the statistics are updated in this window. Click on Stop to freeze the display. 6-4 Maintenance
-
 1
1 -
2
-
3
-
4
-
5
-
6
-
7
-
8
-
9
-
10
-
11
-
12
-
13
-
14
-
15
-
16
-
17
-
18
-
19
-
20
-
21
-
22
-
23
-
24
-
25
-
26
-
27
-
28
-
29
-
30
-
31
-
32
-
33
-
34
-
35
-
36
-
37
-
38
-
39
-
40
-
41
-
42
-
43
-
44
-
45
-
46
-
47
-
48
-
49
-
50
-
51
-
52
-
53
-
54
-
55
-
56
-
57
-
58
-
59
-
60
-
61
-
62
-
 63
63 -
 64
64 -
 65
65 -
 66
66 -
 67
67 -
 68
68 -
 69
69 -
 70
70 -
 71
71 -
 72
72 -
 73
73 -
74
-
75
-
76
-
77
-
78
-
79
-
80
-
81
-
82
-
83
-
84
-
85
-
86
-
87
-
88
-
89
-
90
-
91
-
92
-
93
-
94
-
95
-
96
-
97
-
98
-
99
-
100
-
101
-
102
-
103
-
104
-
105
-
106
-
107
-
108
-
109
-
110
-
111
-
112
-
113
-
114
-
115
-
116
-
117
-
118
-
119
-
120
-
121
-
122
-
123
-
124
-
125
-
126
-
127
-
128
-
129
-
130
-
131
-
132
-
133
-
134
-
135
-
136
-
137
-
138
-
139
-
140
-
141
-
142
-
143
-
144
-
145
-
146
-
147
-
148
-
149
-
150
-
151
-
152
-
153
-
154
-
155
-
156
-
157
-
158
-
159
-
160
-
161
-
162
-
163
-
164
-
165
-
166
-
167
-
168
-
169
-
170
-
171
-
172
-
173
-
174
-
175
-
176
-
177
-
178
-
179
-
180
-
181
-
182
-
183
-
184
-
185
-
186
-
187
-
188
-
189
-
190
-
191
-
192
 |
 |
