Sony FCBEH3300 Product Manual (Tehnical Manual for new HD Block Cameras) - Page 21
Eclipse, Spectral Sensitivity Characteristics, Vibration Specifications
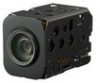 |
View all Sony FCBEH3300 manuals
Add to My Manuals
Save this manual to your list of manuals |
Page 21 highlights
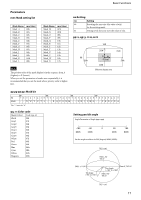
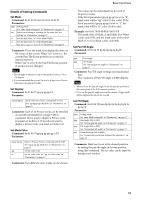
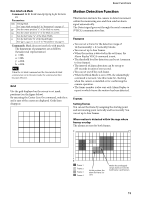
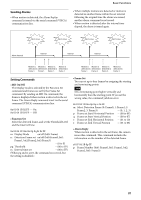
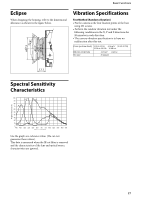
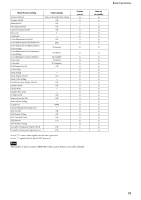
Basic Functions ø37.3 72.6° 41.3° ø31 (ø36.1) Eclipse When designing the housing, refer to the dimensional allowance as shown in the figure below. Vibration Specifications Test Method (Random vibration) • Fix the camera at the four fixation points of the base using M2 screws. • Perform the random vibration test under the following conditions in the X, Y and Z directions for 20 minutes in each direction. • The camera vibration specification is to have no malfunction after this test. Power spectrum density 5 Hz to 50 Hz 4.14 m2/s3 {0.043 G2/Hz} 50 Hz to 100 Hz -36 dB/oct Effective overall value Test time 14.3 m/s2 {1.46 G} 20 minutes 12.7 Spectral Sensitivity Characteristics Use the graph as a reference value. (We can not guarantee these values.) This data is measured when the IR cut filter is removed and the characteristics of the lens and optical source characteristics are ignored. 21
-
 1
1 -
2
-
3
-
4
-
5
-
6
-
7
-
8
-
9
-
10
-
11
-
12
-
13
-
14
-
15
-
 16
16 -
 17
17 -
 18
18 -
 19
19 -
 20
20 -
 21
21 -
 22
22 -
 23
23 -
 24
24 -
 25
25 -
 26
26 -
27
-
28
-
29
-
30
-
31
-
32
-
33
-
34
-
35
-
36
-
37
-
38
-
39
-
40
-
41
-
42
-
43
-
44
-
45
-
46
-
47
-
48
-
49
-
50
-
51
-
52
-
53
-
54
-
55
-
56
-
57
-
58
-
59
-
60
-
61
-
62
-
63
-
64
 |
 |
