TP-Link EAP115 EAP Controller 2.4.X User Guide - Page 20
View the Statistics of the Network, View the Client Distribution on SSID
 |
View all TP-Link EAP115 manuals
Add to My Manuals
Save this manual to your list of manuals |
Page 20 highlights
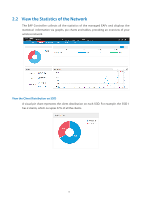
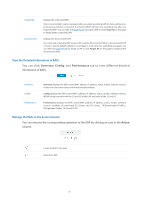
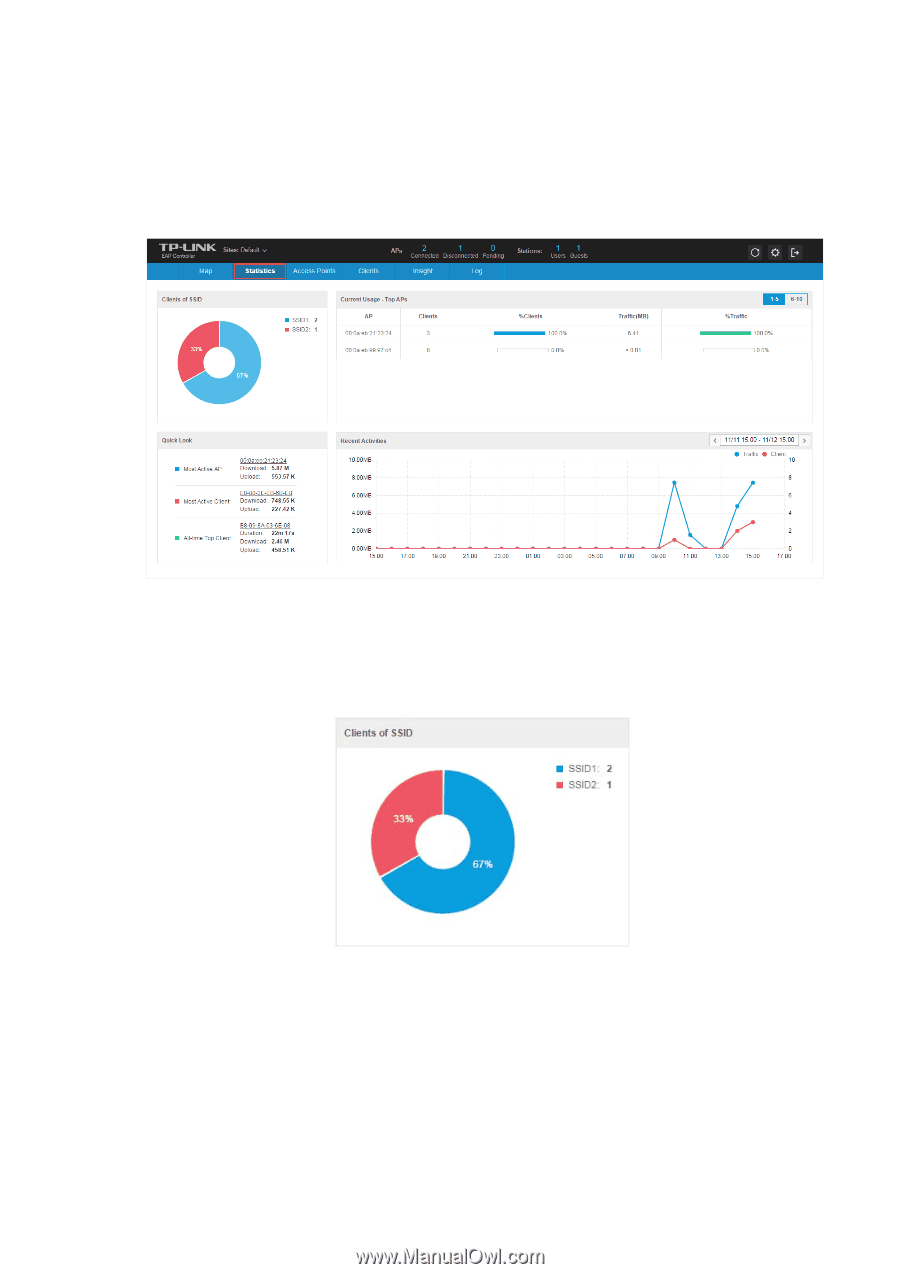
2.2 View the Statistics of the Network The EAP Controller collects all the statistics of the managed EAPs and displays the statistical information via graphs, pie charts and tables, providing an overview of your wireless network. View the Client Distribution on SSID A visual pie chart represents the client distribution on each SSID. For example, the SSID 1 has 2 clients, which occupies 67% of all the clients. 15
-
 1
1 -
2
-
3
-
4
-
5
-
6
-
7
-
8
-
9
-
10
-
11
-
12
-
13
-
14
-
 15
15 -
 16
16 -
 17
17 -
 18
18 -
 19
19 -
 20
20 -
 21
21 -
 22
22 -
 23
23 -
 24
24 -
 25
25 -
26
-
27
-
28
-
29
-
30
-
31
-
32
-
33
-
34
-
35
-
36
-
37
-
38
-
39
-
40
-
41
-
42
-
43
-
44
-
45
-
46
-
47
-
48
-
49
-
50
-
51
-
52
-
53
-
54
-
55
-
56
-
57
-
58
-
59
-
60
-
61
-
62
-
63
-
64
-
65
-
66
-
67
-
68
-
69
-
70
-
71
-
72
-
73
-
74
-
75
-
76
-
77
-
78
-
79
-
80
 |
 |
15
2.2
View the Statistics of the Network
The EAP Controller collects all the statistics of the managed EAPs and displays the
statistical
information via graphs, pie charts and tables, providing an overview of your
wireless network.
View the Client Distribution on SSID
A visual pie chart represents the client distribution on each SSID. For example, the SSID 1
has 2 clients, which occupies 67% of all the clients.