TP-Link EAP115 EAP Controller 2.4.X User Guide - Page 22
Monitor and Manage the EAPs, Manage the EAPs in Different Status
 |
View all TP-Link EAP115 manuals
Add to My Manuals
Save this manual to your list of manuals |
Page 22 highlights
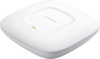
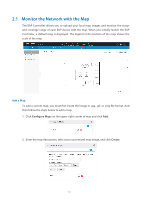
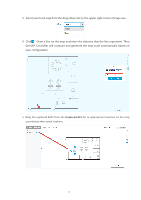
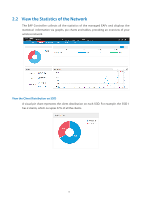
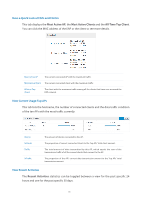
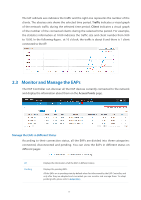
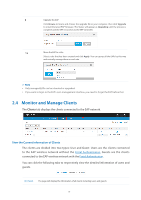
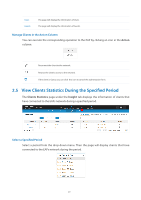
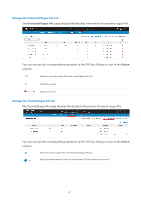
The left ordinate axis indicates the traffic and the right one represents the number of the clients. The abscissa axis shows the selected time period. Traffic indicates a visual graph of the network traffic during the selected time period. Client indicates a visual graph of the number of the connected clients during the selected time period. For example, the statistics information at 10:00 indicates the traffic size and client number from 9:00 to 10:00. In the following figure, at 10 o'clock, the traffic is about 8 and there is 1 client connected to the AP. 2.3 Monitor and Manage the EAPs The EAP Controller can discover all the EAP devices currently connected to the network and display the information about them on the Access Points page. Manage the EAPs in Different Status According to their connection status, all the EAPs are divided into three categories: connected, disconnected and pending. You can view the EAPs in different status on different pages: All Pending Displays the information of all the EAPs in different status. Displays the pending EAPs. All the EAPs are in pending state by default when first discovered by the EAP Controller, and only after they are adopted and connected, you can monitor and manage them. To adopt pending EAPs, please refer to Adopt EAPs. 17
-
 1
1 -
2
-
3
-
4
-
5
-
6
-
7
-
8
-
9
-
10
-
11
-
12
-
13
-
14
-
15
-
16
-
 17
17 -
 18
18 -
 19
19 -
 20
20 -
 21
21 -
 22
22 -
 23
23 -
 24
24 -
 25
25 -
 26
26 -
 27
27 -
28
-
29
-
30
-
31
-
32
-
33
-
34
-
35
-
36
-
37
-
38
-
39
-
40
-
41
-
42
-
43
-
44
-
45
-
46
-
47
-
48
-
49
-
50
-
51
-
52
-
53
-
54
-
55
-
56
-
57
-
58
-
59
-
60
-
61
-
62
-
63
-
64
-
65
-
66
-
67
-
68
-
69
-
70
-
71
-
72
-
73
-
74
-
75
-
76
-
77
-
78
-
79
-
80
 |
 |