| Section |
Page |
| TI-82 Graping Calculator Guidebook |
1 |
| Important & US FCC Information |
2 |
| Table of Contents |
3 |
| Getting Started: Do This First! |
3 |
| Chapter 1: Operating the TI.82 |
3 |
| Chapter 2: Math, Angle, and Test Operations |
4 |
| Chapter 3: Function Graphing |
4 |
| Chapter 4: Parametric Graphing |
4 |
| Chapter 5: Polar Graphing |
4 |
| Chapter 6: Sequence Graphing |
5 |
| Chapter 7: Tables |
5 |
| Chapter 8: DRAW Operations |
5 |
| Chapter 9: Split Screen |
5 |
| Chapter 10: Matrices |
6 |
| Chapter 11: Lists |
6 |
| Chapter 12: Statistics |
6 |
| Chapter 13: Programming |
6 |
| Chapter 14: Applications |
7 |
| Chapter 15: Memory Management |
7 |
| Chapter 16: Communication Link |
7 |
| Appendix A: Tables |
7 |
| Appendix B: Reference Information |
7 |
| Index |
7 |
| Using this Guidebook Effectively |
8 |
| Structure of the Guidebook |
8 |
| Page-Design Conventions |
8 |
| Information-Mapping Conventions |
9 |
| Reference Aids |
9 |
| Glossary |
10 |
| Getting Started: Do This First! |
11 |
| TI-82 Menus |
12 |
| Displaying a Menu |
12 |
| Moving from One Menu to Another |
12 |
| Selecting an Item from a Menu |
12 |
| Leaving without Making a Selection |
12 |
| First Steps |
13 |
| Entering a Calculation: Compound Interest |
14 |
| Defining a Function: Box with Lid |
16 |
| Defining a Table of Values |
17 |
| Zooming In on the Table |
18 |
| Changing the Viewing WINDOW |
20 |
| Displaying and Tracing the Graph |
21 |
| Zooming on the Graph |
22 |
| Finding the Calculated Maximum |
23 |
| Other Features |
24 |
| Graphing |
24 |
| Sequences |
24 |
| Tables |
24 |
| Matrices |
24 |
| Lists |
24 |
| Statistics |
24 |
| Programming |
24 |
| Split Screen |
24 |
| Chapter 1: Operating the TI-82 |
25 |
| Turning the TI-82 On and Off |
26 |
| Turning the Calculator On |
26 |
| Turning the Calculator Off |
26 |
| APD™ (Automatic Power Down™) |
26 |
| Batteries |
26 |
| Setting the Display Contrast |
27 |
| Adjusting the Display Contrast |
27 |
| When to Replace Batteries |
27 |
| The Display |
28 |
| Home Screen |
28 |
| Displaying Entries and Answers |
28 |
| Returning to the Home Screen |
28 |
| Display Cursors |
29 |
| Busy Indicator |
29 |
| Entering Expressions and Instructions |
30 |
| Expressions |
30 |
| Entering an Expression |
30 |
| Multiple Entries on a Line |
30 |
| Entering a Number in Scientific Notation |
31 |
| Functions |
31 |
| Instructions |
31 |
| Interrupting a Calculation |
31 |
| TI-82 Edit Keys |
32 |
| Setting Modes |
33 |
| Checking MODE Settings |
33 |
| Changing MODE Settings |
33 |
| Leaving the MODE Screen |
33 |
| Setting a MODE from a Program |
33 |
| TI-82 Modes |
34 |
| Normal, Sci, Eng |
34 |
| Float, Fix |
34 |
| Radian, Degree |
35 |
| Func, Par, Pol, Seq |
35 |
| Connected, Dot |
35 |
| Sequential, Simul |
35 |
| FullScreen, Split |
35 |
| Variable Names |
36 |
| Variables and Defined Items |
36 |
| Storing and Recalling Variable Values |
37 |
| Storing Values in a Variable |
37 |
| Displaying a Variable Value |
37 |
| RCL (Recall) |
37 |
| Last Entry |
38 |
| Using Last Entry |
38 |
| Multiple Entries on a Line |
38 |
| Reexecuting the Previous Entry |
39 |
| Accessing a Previous Entry |
39 |
| Last Answer |
40 |
| Using Ans in an Expression |
40 |
| Continuing an Expression |
40 |
| Storing Answers |
40 |
| TI-82 Menus |
41 |
| Moving from One Menu to Another |
41 |
| Selecting an Item from a Menu |
41 |
| Leaving a Menu without Making a Selection |
41 |
| VARS and Y-VARS Menus |
43 |
| VARS Menu |
43 |
| Y-VARS Menu |
43 |
| Accessing a Name from a VARS or Y-VARS Menu |
43 |
| EOS™ (Equation Operating System) |
44 |
| Order of Evaluation |
44 |
| Implied Multiplication |
45 |
| Parentheses |
45 |
| Negation |
45 |
| Error Conditions |
46 |
| Diagnosing an Error |
46 |
| Correcting an Error |
46 |
| Chapter 2: Math, Angle, and Test Operations |
47 |
| Getting Started: Lottery Chances |
48 |
| Keyboard Math Operations |
49 |
| Using Lists with Functions |
49 |
| + (Add), – (Subtract), * (Multiply), / (Divide) |
49 |
| Trig Functions |
49 |
| ^ (Power), ² (Square), (Square Root) |
49 |
| -1 (Inverse) |
49 |
| log, 10^, ln |
50 |
| e^ |
50 |
| - (Negation) |
50 |
| abs |
50 |
| (Pi) |
50 |
| MATH MATH Operations |
51 |
| MATH MATH Menu |
51 |
| >Frac |
51 |
| >Dec |
51 |
| ³ (Cube) |
52 |
| (Cube Root) |
52 |
| xth (Root) |
52 |
| fMin(, fMax( |
52 |
| nDeriv( |
53 |
| fnInt( |
53 |
| solve( |
54 |
| Controlling the Solution for solve( |
54 |
| MATH NUM (Number) Operations |
55 |
| MATH NUM Menu |
55 |
| round( |
55 |
| iPart |
55 |
| fPart |
55 |
| int |
56 |
| min(, max( |
56 |
| MATH HYP (Hyperbolic) Operations |
57 |
| MATH HYP Menu |
57 |
| sinh, cosh, tanh |
57 |
| sinh^ -1, cos^-1, tanh^-1 |
57 |
| MATH PRB (Probability) Operations |
58 |
| MATH PRB Menu |
58 |
| rand |
58 |
| nPr |
58 |
| nCr |
58 |
| ! (Factorial) |
58 |
| ANGLE Operations |
59 |
| ANGLE Menu |
59 |
| °( Degree) |
59 |
| ' (DMS Entry Notation) |
59 |
| r (Radians) |
59 |
| R>Pr(, R>Pq(, P>Rx(, P>Ry( |
60 |
| TEST TEST (Relational) Operations |
61 |
| TEST TEST Menu |
61 |
| =, ne, >, ge>, <. le< |
61 |
| Using Tests |
61 |
| TEST LOGIC (Boolean) Operations |
62 |
| TEST LOGIC Menu |
62 |
| Boolean Operators |
62 |
| and, or, xor |
62 |
| not |
62 |
| Using Boolean Operations |
62 |
| Chapter 3: Function Graphing |
63 |
| Getting Started: Graphing a Circle |
64 |
| Defining a Graph |
65 |
| Steps in Defining a Graph |
65 |
| Exploring a Graph |
65 |
| Saving a Graph |
65 |
| Setting Graph Modes |
66 |
| Checking and Changing Graphing Modes |
66 |
| Setting Modes from a Program |
66 |
| Defining Functions in the Y= List |
67 |
| Displaying the Functions in the Y= List |
67 |
| Defining a New Function |
67 |
| Editing a Function |
68 |
| Clearing a Function |
68 |
| Defining Functions from the Home Screen or a Program |
68 |
| Evaluating Y= Functions in Expressions |
68 |
| Selecting Functions |
69 |
| Turning a Function “On” or “Off” |
69 |
| Leaving the Y= Edit Screen |
69 |
| Selecting Functions from the Home Screen or a Program |
69 |
| Defining the Viewing |
70 |
| TI-82 Viewing WINDOW |
70 |
| Checking the Viewing WINDOW |
70 |
| Changing a WINDOW Variable Value |
70 |
| Leaving the WINDOW Edit Screen |
71 |
| Storing to a WINDOW Variable from the Home Screen or a Program |
71 |
| Delta X and Delta Y |
71 |
| Setting WINDOW FORMAT |
72 |
| Checking WINDOW FORMAT |
72 |
| Changing WINDOW FORMAT |
72 |
| RectGC, PolarGC |
72 |
| CoordOn, CoordOff |
72 |
| GridOff, GridOn |
72 |
| AxesOn, AxesOff |
72 |
| LabelOff, LabelOn |
72 |
| Displaying a Graph |
73 |
| Displaying a New Graph |
73 |
| Pausing a Graph |
73 |
| Smart Graph |
73 |
| Graphing a Family of Curves |
74 |
| Exploring a Graph with the Free-Moving Cursor |
75 |
| Free-Moving Cursor |
75 |
| Graphing Accuracy |
75 |
| Exploring a Graph with TRACE |
76 |
| Beginning a Trace |
76 |
| Moving along a Function |
76 |
| Panning to the Left or Right |
76 |
| QuickZoom |
76 |
| Moving from Function to Function |
77 |
| Leaving TRACE |
77 |
| Using TRACE in a Program |
77 |
| Exploring a Graph with ZOOM |
78 |
| ZOOM Menu |
78 |
| ZBox |
78 |
| Zoom In, Zoom Out |
79 |
| Zoom Out |
79 |
| Leaving Zoom In or Zoom Out |
79 |
| ZDecimal |
80 |
| ZSquare |
80 |
| ZStandard |
80 |
| ZTrig |
80 |
| ZInteger |
80 |
| ZoomStat |
80 |
| Using ZOOM MEMORY |
81 |
| ZOOM MEMORY Menu |
81 |
| ZPrevious |
81 |
| ZoomSto |
81 |
| ZoomRcl |
81 |
| Using ZOOM MEMORY from the Home Screen or a Program |
81 |
| Setting ZOOM FACTORS |
82 |
| ZOOM FACTORS |
82 |
| Checking XFact and YFact |
82 |
| Changing XFact and YFact |
82 |
| Leaving ZOOM FACTORS |
82 |
| Using CALC (Calculate) Operations |
83 |
| CALCULATE Menu |
83 |
| value |
83 |
| root |
84 |
| minimum, maximum |
85 |
| intersect |
85 |
| dy/dx |
86 |
| Integral f(x)dx |
86 |
| Chapter 4: Parametric Graphing |
87 |
| Getting Started: Path of a Ball |
88 |
| Defining and Displaying a Parametric Graph |
89 |
| Defining a Parametric Graph |
89 |
| Setting Parametric Graph Modes |
89 |
| Displaying Parametric Equations |
89 |
| Defining Parametric Equations |
89 |
| Selecting Parametric Equations |
90 |
| Setting WINDOW Variables |
90 |
| Setting the WINDOW FORMAT |
91 |
| Displaying a Graph |
91 |
| WINDOW Variables and Y-VARS Menus |
91 |
| Exploring a Parametric Graph |
92 |
| Free-Moving Cursor |
92 |
| TRACE |
92 |
| ZOOM |
92 |
| CALC |
92 |
| Chapter 5: Polar Graphing |
93 |
| Getting Started: Polar Rose |
94 |
| Defining and Displaying a Polar Graph |
95 |
| Defining a Polar Graph |
95 |
| Setting Polar Graph Modes |
95 |
| Displaying Polar Equations |
95 |
| Defining Polar Equations |
95 |
| Selecting Polar Equations |
95 |
| Setting WINDOW Variables |
96 |
| Setting the WINDOW FORMAT |
96 |
| Displaying a Graph |
97 |
| WINDOW Variables and Y-VARS Menus |
97 |
| Exploring a Polar Graph |
98 |
| Free-Moving Cursor |
98 |
| TRACE |
98 |
| ZOOM |
98 |
| CALC |
98 |
| Chapter 6: Sequence Graphing |
99 |
| Getting Started: Forest and Trees |
100 |
| Defining and Displaying a Sequence Graph |
101 |
| Defining a Sequence Graph |
101 |
| Setting Sequence Graph Modes |
101 |
| Displaying Sequence Functions |
101 |
| Defining Sequence Functions |
101 |
| Selecting Sequence Functions |
102 |
| Setting the WINDOW Variables |
102 |
| Setting WINDOW FORMAT |
103 |
| Displaying a Graph |
103 |
| Evaluating Un and Vn |
103 |
| Exploring a Sequence Graph |
104 |
| Free-Moving Cursor |
104 |
| TRACE |
104 |
| ZOOM |
104 |
| CALC |
104 |
| Chapter 7: Tables |
105 |
| Getting Started: Roots of a Function |
106 |
| Defining the Variables |
107 |
| TABLE SETUP Screen |
107 |
| TblMin and Delta Tbl |
107 |
| Indpnt: Auto or Ask |
107 |
| Depend: Auto or Ask |
107 |
| Setting Up a Table from the Home Screen or a Program |
107 |
| Defining the Dependent Variable |
108 |
| From the Y= Editor |
108 |
| From the Table Editor |
108 |
| Displaying the Table |
109 |
| The Table |
109 |
| Displaying More Independent Values |
110 |
| Displaying Other Dependent Variables |
110 |
| Clearing the Table |
110 |
| Chapter 8: DRAW Operations |
111 |
| Getting Started: Shading a Graph |
112 |
| DRAW DRAW Menu |
113 |
| DRAW DRAW Menu |
113 |
| Before Drawing on a Graph |
113 |
| Drawing on a Graph |
113 |
| Drawing Lines |
114 |
| Directly on a Graph |
114 |
| From the Home Screen or a Program |
114 |
| Drawing Horizontal and Vertical Lines |
115 |
| Directly on a Graph |
115 |
| From the Home Screen or a Program |
115 |
| Drawing Tangent Lines |
116 |
| Directly on a Graph |
116 |
| From the Home Screen or a Program |
116 |
| Drawing Functions and Inverses |
117 |
| Drawing a Function |
117 |
| Drawing an Inverse of a Function |
117 |
| Shading Areas on a Graph |
118 |
| Shading a Graph |
118 |
| Drawing Circles |
119 |
| Directly on a Graph |
119 |
| From the Home Screen or a Program |
119 |
| Placing Text on a Graph |
120 |
| Directly on a Graph |
120 |
| From the Home Screen or a Program |
120 |
| Split Screen |
120 |
| Using Pen to Draw on a Graph |
121 |
| Using Pen |
121 |
| Drawing Points |
122 |
| DRAW POINTS Menu |
122 |
| Directly on a Graph |
122 |
| Pt-Off(, Pt Change( |
122 |
| From the Home Screen or a Program |
122 |
| Drawing Pixels |
123 |
| TI.82 Pixels |
123 |
| Turning Pixels On and Off |
123 |
| pxl-Test( |
123 |
| Split Screen |
123 |
| Storing and Recalling Graph Pictures |
124 |
| DRAW STO Menu |
124 |
| Storing a Graph Picture |
124 |
| Recalling a Graph Picture |
124 |
| Deleting a Graph Picture |
124 |
| Storing and Recalling Graph Databases |
125 |
| Graph Databases |
125 |
| Storing a Graph Database |
125 |
| Recalling a Graph Database |
125 |
| Deleting a Graph Database |
125 |
| Clearing a Drawing |
126 |
| When a Graph is Displayed |
126 |
| From the Home Screen or a Program |
126 |
| Chapter 9: Split Screen |
127 |
| Getting Started: Polynomial Coefficients |
128 |
| Using Split Screen |
129 |
| Setting Screen MODE |
129 |
| Split Screen: Top |
129 |
| Split Screen: Bottom |
129 |
| Exceptions |
129 |
| TI-82 Pixels |
130 |
| DRAW Pixels Instructions |
130 |
| DRAW Text Instruction |
130 |
| PRGM Output Instruction |
130 |
| Setting Screen MODE from the Home Screen or a Program |
130 |
| Chapter 10: Matrices |
131 |
| Getting Started: Systems of Linear Equations |
132 |
| Defining a Matrix |
134 |
| Selecting a Matrix |
134 |
| Accepting or Changing Matrix Dimensions |
134 |
| Viewing Matrix Elements |
135 |
| Displaying Matrix Elements |
135 |
| Leaving the MATRX Edit Screen |
135 |
| Deleting a Matrix |
135 |
| Editing Matrix Elements |
136 |
| Viewing a Matrix |
136 |
| Viewing Context Keys |
136 |
| Editing a Matrix Element |
137 |
| Editing Context Keys |
137 |
| About Matrices |
138 |
| Using a Matrix in an Expression |
138 |
| Entering a Matrix in an Expression |
138 |
| Displaying a Matrix |
139 |
| Copying One Matrix to Another |
139 |
| Accessing a Matrix Element |
139 |
| Matrix Math Functions |
140 |
| + (Add), – (Subtract |
140 |
| * (Multiply) |
140 |
| - (Negate) |
140 |
| abs |
140 |
| round( |
141 |
| -1 (Inverse) |
141 |
| Powers |
141 |
| Relational Operations |
141 |
| iPart, fPart, int |
141 |
| MATRX MATH Operations |
142 |
| MATRX MATH Menu |
142 |
| det |
142 |
| T (Transpose) |
142 |
| Accessing Matrix Dimensions with dim |
142 |
| Creating a Matrix with dim |
143 |
| Redimensioning a Matrix with dim |
143 |
| Fill( |
143 |
| identity |
143 |
| randM( |
143 |
| augment( |
144 |
| Row Operations |
144 |
| rowSwap( |
144 |
| row+( |
144 |
| *row( |
144 |
| *row+( |
144 |
| Chapter 11: Lists |
145 |
| Getting Started: Generating a Sequence |
146 |
| About Lists |
147 |
| Using a List in an Expression |
147 |
| Entering a List in an Expression |
147 |
| Saving a List in Memory |
147 |
| Displaying a List |
148 |
| Copying One List to Another |
148 |
| Accessing a List Element |
148 |
| Lists in Graphing |
148 |
| Notes about Using Math Functions with Lists |
149 |
| LIST OPS Operations |
150 |
| LIST OPS Menu |
150 |
| SortA(, SortD( |
150 |
| Accessing List Dimensions with dim |
151 |
| Creating a List with dim |
151 |
| Redimensioning a List with dim |
151 |
| Fill( |
152 |
| seq( |
152 |
| LIST MATH Operations |
153 |
| LIST MATH Menu |
153 |
| min(, max( |
153 |
| mean(, median( |
153 |
| sum |
154 |
| prod |
154 |
| Sums and Products of Numeric Sequences |
154 |
| Chapter 12: Statistics |
155 |
| Getting Started: Building Height and City Size |
156 |
| Setting Up a Statistical Analysis |
163 |
| Steps |
163 |
| Displaying the STAT List Editor |
163 |
| Leaving the STAT List Editor |
163 |
| Deleting a List |
163 |
| Viewing List Elements |
164 |
| Viewing Context Keys |
164 |
| Editing List Elements |
165 |
| Editing Context Keys |
165 |
| Editing a List Element |
165 |
| STAT EDIT Menu |
166 |
| STAT EDIT Menu |
166 |
| SortA(, SortD( |
166 |
| ClrList |
166 |
| Statistical Analysis |
167 |
| STAT CALC Menu |
167 |
| SET UP CALCS Screen |
167 |
| Changing Settings |
167 |
| Statistical Variables |
168 |
| Q1 and Q3 |
168 |
| Types of Statistical Analysis |
169 |
| 1-Var Stats |
169 |
| 2-Var Stats |
169 |
| Med.Med |
169 |
| LinReg (ax+b) |
169 |
| QuadReg |
169 |
| CubicReg |
169 |
| QuartReg |
169 |
| LinReg (a+bx) |
170 |
| LnReg |
170 |
| ExpReg |
170 |
| PwrReg |
170 |
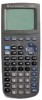
| Statistical Analysis in a Program |
171 |
| Entering Stat Data |
171 |
| Statistical Calculations |
171 |
| Statistical Plotting |
172 |
| Steps |
172 |
| Scatter Plot |
172 |
| xyLine |
172 |
| Boxplot |
173 |
| Histogram |
173 |
| Defining the Plots |
174 |
| Turning Plots Off or On |
175 |
| Defining the Viewing WINDOW |
175 |
| Tracing a Stat Plot |
175 |
| Statistical Plotting in a Program |
176 |
| Stat Plots |
176 |
| Defining a Stat Plot |
176 |
| Displaying a Stat Plot |
176 |
| Chapter 13: Programming |
177 |
| Getting Started: Family of Curves |
178 |
| About TI-82 Programs |
180 |
| Notes about Programs |
180 |
| \ |
180 |
| Memory Management and Erasing Programs |
180 |
| Creating and Executing Programs |
181 |
| Creating a New Program |
181 |
| Editing a Program |
181 |
| Leaving the Program Editor |
181 |
| Executing a Program |
181 |
| Editing Programs |
182 |
| Entering Program Commands |
182 |
| Changing |
182 |
| Inserting |
182 |
| Deleting |
182 |
| Copying a Program |
182 |
| PRGM CTL (Control) Instructions |
183 |
| PRGM CTL Menu |
183 |
| Controlling Program Flow |
183 |
| If |
183 |
| If-Then |
184 |
| If-Then-Else |
184 |
| For( |
184 |
| While |
185 |
| Repeat |
185 |
| End |
185 |
| Pause |
186 |
| Lbl, Goto |
186 |
| IS>( |
186 |
| DS<( |
186 |
| Menu( |
187 |
| prgm |
187 |
| Return |
188 |
| Stop |
188 |
| PRGM I/O (Input/Output) Instructions |
189 |
| PRGM I/O Menu |
189 |
| Input |
189 |
| Displaying a Graph with Input |
189 |
| Storing a Variable Value with Input |
189 |
| Disp |
190 |
| Displaying the Home Screen |
190 |
| Displaying Values and Messages |
190 |
| Prompt |
191 |
| DispGraph |
191 |
| DispTable |
191 |
| Output( |
191 |
| getKey |
192 |
| ClrHome |
193 |
| ClrTable |
193 |
| PrintScreen |
193 |
| Get( |
193 |
| Send( |
193 |
| Calling Other Programs |
194 |
| Calling a Program from Another Program |
194 |
| Notes about Calling Programs |
194 |
| Chapter 14: Applications |
195 |
| Left-Brain, Right-Brain Test Results |
196 |
| Problem |
196 |
| Procedure |
196 |
| Speeding Tickets |
198 |
| Problem |
198 |
| Procedure |
198 |
| Buying a Car, Now or Later? |
199 |
| Procedure |
199 |
| Graphing Inequalities |
200 |
| Procedure |
200 |
| Solving a System of Nonlinear Equations |
201 |
| Procedure |
201 |
| Program: Sierpinski Triangle |
202 |
| Program |
202 |
| Cobweb Attractors |
203 |
| Procedure |
203 |
| Program: Guess the Coefficients |
204 |
| Program |
204 |
| The Unit Circle and Trigonometric Curves |
205 |
| Problem |
205 |
| Solution |
205 |
| Ferris Wheel Problem |
206 |
| Problem |
206 |
| Solution |
206 |
| Reservoir Problem |
208 |
| Problem |
208 |
| Procedure |
208 |
| Predator-Prey Model |
210 |
| Problem |
210 |
| Procedure |
210 |
| Fundamental Theorem of Calculus |
212 |
| Problem 1 |
212 |
| Procedure 1 |
212 |
| Problem 2 |
213 |
| Procedure 2 |
213 |
| Finding the Area between Curves |
214 |
| Procedure |
214 |
| Chapter 15: Memory Management |
215 |
| Checking Available Memory |
216 |
| Displaying the MEM FREE Screen |
216 |
| Deleting Items from Memory |
217 |
| Deleting an Item |
217 |
| Resetting the TI-82 |
218 |
| Resetting |
218 |
| Chapter 16: Communication Link |
219 |
| Getting Started: Sending Variables |
220 |
| TI-82 LINK |
221 |
| Linking to Another TI-82 |
221 |
| Linking to a CBL 2/CBL or CBR |
221 |
| Linking to a PC or Macintosh |
221 |
| Connecting the Cable |
221 |
| Leaving a LINK Screen or Menu |
221 |
| Selecting Items |
222 |
| What You Can Send |
222 |
| Selecting Items to Send |
223 |
| Transmitting Items |
224 |
| Transmitting Items |
224 |
| Transmitting Items to an Additional TI-82 |
224 |
| Error Conditions |
224 |
| Receiving Items |
225 |
| Receiving Unit |
225 |
| Duplicate Name |
225 |
| Insufficient Memory in Receiving Unit |
225 |
| Backing Up Memory |
226 |
| Memory Backup |
226 |
| Receiving Unit |
226 |
| Appendix A: Tables |
227 |
| Table of Functions and Instructions |
228 |
| A, C |
228 |
| D |
230 |
| E |
231 |
| F |
232 |
| G, H, I |
234 |
| L |
236 |
| M |
237 |
| N |
238 |
| O |
239 |
| P |
240 |
| Q |
241 |
| R |
242 |
| S |
243 |
| T |
246 |
| V, W, Z |
247 |
| TI-82 Menu Map |
248 |
| Table of Variables |
254 |
| User Variables |
254 |
| System Variables |
254 |
| Appendix B: Reference Information |
255 |
| Battery Information |
256 |
| When to Replace the Batteries |
256 |
| Effects of Replacing the Batteries |
256 |
| Battery Precautions |
256 |
| Replacing the Batteries |
257 |
| In Case of Difficulty |
258 |
| Handling a Difficulty |
258 |
| Accuracy Information |
259 |
| Computational Accuracy |
259 |
| Graphing Accuracy |
259 |
| Function Limits |
260 |
| Function Results |
260 |
| Error Conditions |
261 |
| Support and Service Information |
265 |
| Product Support |
265 |
| Product Service |
265 |
| Other TI Products and Services |
265 |
| Warranty Information |
266 |
| Customers in the U.S. and Canada Only |
266 |
| Australia & New Zealand Customers only |
267 |
| All Customers Outside the U.S. and Canada |
267 |
| Index |
268 |
| A, B, C |
268 |
| D |
269 |
| E, F |
270 |
| G, H, I |
271 |
| L, M |
272 |
| N, O, P |
273 |
| Q, R |
274 |
| S |
275 |
| T, U, V, W, X |
276 |
| Y, Z |
277 |
 1
1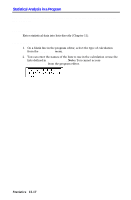 171
171 172
172 173
173 174
174 175
175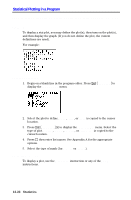 176
176 177
177 178
178 179
179 180
180 181
181