Texas Instruments TI-82 User Manual - Page 95
Defining and Displaying a Polar Graph
 |
UPC - 033317086337
View all Texas Instruments TI-82 manuals
Add to My Manuals
Save this manual to your list of manuals |
Page 95 highlights
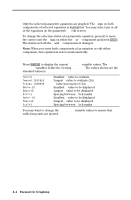
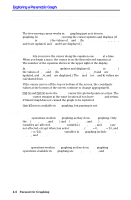
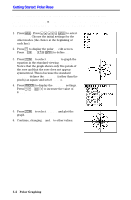
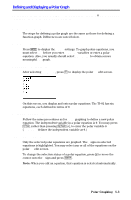
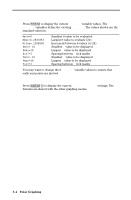
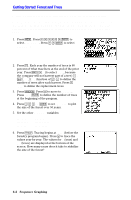
Defining and Displaying a Polar Graph Polar equations are defined in terms of the independent variable q. Up to six polar equations can be defined and graphed at a time. Defining a Polar Graph The steps for defining a polar graph are the same as those for defining a function graph. Differences are noted below. Setting Polar Graph Modes Press z to display the MODE settings. To graph polar equations, you must select Pol before you enter WINDOW variables or enter a polar equation. Also, you usually should select Connected to obtain a more meaningful Pol graph. Displaying Polar Equations After selecting Pol MODE, press o to display the polar Y= edit screen. On this screen, you display and enter polar equations. The TI.82 has six equations, each defined in terms of q. Defining Polar Equations Follow the same procedures as for Func graphing to define a new polar equation. The independent variable in a polar equation is q. You may press „, rather than pressing ƒ ãqä, to enter the polar variable q. (Pol MODE defines the independent variable as q.) Selecting Polar Equations Only the selected polar equations are graphed. The = sign on selected equations is highlighted. You may select any or all of the equations on the polar Y= edit screen. To change the selection status of a polar equation, press | to move the cursor onto the = sign and press Í. Note: When you edit an equation, that equation is selected automatically. Polar Graphing 5-3
-
 1
1 -
2
-
3
-
4
-
5
-
6
-
7
-
8
-
9
-
10
-
11
-
12
-
13
-
14
-
15
-
16
-
17
-
18
-
19
-
20
-
21
-
22
-
23
-
24
-
25
-
26
-
27
-
28
-
29
-
30
-
31
-
32
-
33
-
34
-
35
-
36
-
37
-
38
-
39
-
40
-
41
-
42
-
43
-
44
-
45
-
46
-
47
-
48
-
49
-
50
-
51
-
52
-
53
-
54
-
55
-
56
-
57
-
58
-
59
-
60
-
61
-
62
-
63
-
64
-
65
-
66
-
67
-
68
-
69
-
70
-
71
-
72
-
73
-
74
-
75
-
76
-
77
-
78
-
79
-
80
-
81
-
82
-
83
-
84
-
85
-
86
-
87
-
88
-
89
-
 90
90 -
 91
91 -
 92
92 -
 93
93 -
 94
94 -
 95
95 -
 96
96 -
 97
97 -
 98
98 -
 99
99 -
 100
100 -
101
-
102
-
103
-
104
-
105
-
106
-
107
-
108
-
109
-
110
-
111
-
112
-
113
-
114
-
115
-
116
-
117
-
118
-
119
-
120
-
121
-
122
-
123
-
124
-
125
-
126
-
127
-
128
-
129
-
130
-
131
-
132
-
133
-
134
-
135
-
136
-
137
-
138
-
139
-
140
-
141
-
142
-
143
-
144
-
145
-
146
-
147
-
148
-
149
-
150
-
151
-
152
-
153
-
154
-
155
-
156
-
157
-
158
-
159
-
160
-
161
-
162
-
163
-
164
-
165
-
166
-
167
-
168
-
169
-
170
-
171
-
172
-
173
-
174
-
175
-
176
-
177
-
178
-
179
-
180
-
181
-
182
-
183
-
184
-
185
-
186
-
187
-
188
-
189
-
190
-
191
-
192
-
193
-
194
-
195
-
196
-
197
-
198
-
199
-
200
-
201
-
202
-
203
-
204
-
205
-
206
-
207
-
208
-
209
-
210
-
211
-
212
-
213
-
214
-
215
-
216
-
217
-
218
-
219
-
220
-
221
-
222
-
223
-
224
-
225
-
226
-
227
-
228
-
229
-
230
-
231
-
232
-
233
-
234
-
235
-
236
-
237
-
238
-
239
-
240
-
241
-
242
-
243
-
244
-
245
-
246
-
247
-
248
-
249
-
250
-
251
-
252
-
253
-
254
-
255
-
256
-
257
-
258
-
259
-
260
-
261
-
262
-
263
-
264
-
265
-
266
-
267
-
268
-
269
-
270
-
271
-
272
-
273
-
274
-
275
-
276
-
277
-
278
 |
 |