Texas Instruments TI-82 User Manual - Page 80
variables
 |
UPC - 033317086337
View all Texas Instruments TI-82 manuals
Add to My Manuals
Save this manual to your list of manuals |
Page 80 highlights
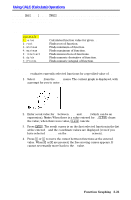
ZDecimal ZDecimal replots the functions immediately, updating the WINDOW variables to preset values that set @X and @Y equal to .1 and defining the X and Y value of each pixel as one decimal. Xmin = M4.7 Xmax = 4.7 Xscl = 1 Ymin = M3.1 Ymax = 3.1 Yscl = 1 ZSquare ZSquare replots the functions immediately, redefining the WINDOW based on the current WINDOW variables, but adjusted in only one direction so that @X=@Y. This makes the graph of a circle look like a circle. Xscl and Yscl remain unchanged. The midpoint of the current graph (not the intersection of the axes) becomes the midpoint of the new graph. ZStandard ZStandard replots the functions immediately, updating the WINDOW variables to the standard values: Xmin = M10 Xmax = 10 Xscl = 1 Ymin = M10 Ymax = 10 Yscl = 1 ZTrig ZTrig replots the functions immediately, updating the WINDOW variables to preset values appropriate for trig plotting functions. In Radian MODE these are: Xmin = M(47à24)p Xmax = (47à24)p Xscl = p/2 Ymin = M4 Ymax = 4 Yscl = 1 ZInteger ZInteger redefines the viewing WINDOW so @X=1 and @Y=1, Xscl=10, and Yscl=10, replotting the functions after you move the cursor to the point that you want as the center of the new WINDOW and press Í. ZoomStat ZoomStat redefines the viewing WINDOW so that all statistical data points are displayed. For one-variable plots (histograms and box plots), only Xmin and Xmax are adjusted. If the top of the histogram is not shown, use TRACE to determine the value for Ymax. 3-18 Function Graphing
-
 1
1 -
2
-
3
-
4
-
5
-
6
-
7
-
8
-
9
-
10
-
11
-
12
-
13
-
14
-
15
-
16
-
17
-
18
-
19
-
20
-
21
-
22
-
23
-
24
-
25
-
26
-
27
-
28
-
29
-
30
-
31
-
32
-
33
-
34
-
35
-
36
-
37
-
38
-
39
-
40
-
41
-
42
-
43
-
44
-
45
-
46
-
47
-
48
-
49
-
50
-
51
-
52
-
53
-
54
-
55
-
56
-
57
-
58
-
59
-
60
-
61
-
62
-
63
-
64
-
65
-
66
-
67
-
68
-
69
-
70
-
71
-
72
-
73
-
74
-
 75
75 -
 76
76 -
 77
77 -
 78
78 -
 79
79 -
 80
80 -
 81
81 -
 82
82 -
 83
83 -
 84
84 -
 85
85 -
86
-
87
-
88
-
89
-
90
-
91
-
92
-
93
-
94
-
95
-
96
-
97
-
98
-
99
-
100
-
101
-
102
-
103
-
104
-
105
-
106
-
107
-
108
-
109
-
110
-
111
-
112
-
113
-
114
-
115
-
116
-
117
-
118
-
119
-
120
-
121
-
122
-
123
-
124
-
125
-
126
-
127
-
128
-
129
-
130
-
131
-
132
-
133
-
134
-
135
-
136
-
137
-
138
-
139
-
140
-
141
-
142
-
143
-
144
-
145
-
146
-
147
-
148
-
149
-
150
-
151
-
152
-
153
-
154
-
155
-
156
-
157
-
158
-
159
-
160
-
161
-
162
-
163
-
164
-
165
-
166
-
167
-
168
-
169
-
170
-
171
-
172
-
173
-
174
-
175
-
176
-
177
-
178
-
179
-
180
-
181
-
182
-
183
-
184
-
185
-
186
-
187
-
188
-
189
-
190
-
191
-
192
-
193
-
194
-
195
-
196
-
197
-
198
-
199
-
200
-
201
-
202
-
203
-
204
-
205
-
206
-
207
-
208
-
209
-
210
-
211
-
212
-
213
-
214
-
215
-
216
-
217
-
218
-
219
-
220
-
221
-
222
-
223
-
224
-
225
-
226
-
227
-
228
-
229
-
230
-
231
-
232
-
233
-
234
-
235
-
236
-
237
-
238
-
239
-
240
-
241
-
242
-
243
-
244
-
245
-
246
-
247
-
248
-
249
-
250
-
251
-
252
-
253
-
254
-
255
-
256
-
257
-
258
-
259
-
260
-
261
-
262
-
263
-
264
-
265
-
266
-
267
-
268
-
269
-
270
-
271
-
272
-
273
-
274
-
275
-
276
-
277
-
278
 |
 |