Texas Instruments TI-82 User Manual - Page 35
Radian, Degree, Func, Par, Pol, Seq, Connected, Dot, Sequential, Simul, FullScreen, Split
 |
UPC - 033317086337
View all Texas Instruments TI-82 manuals
Add to My Manuals
Save this manual to your list of manuals |
Page 35 highlights
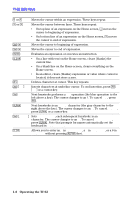
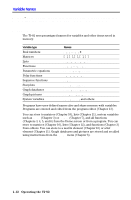
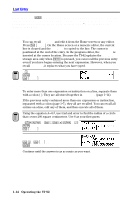
Radian, Degree Angle settings control how the TI.82 interprets angle values in trig functions and polar/rectangular conversions. Radian interprets the values as radians. Answers display in radians. Degree interprets the values as degrees. Answers display in degrees. Func, Par, Pol, Seq Func (function) graphing plots functions where Y is a function of X (Chapter 3). Par (parametric) graphing plots relations where X and Y are functions of T (Chapter 4). Pol (polar) graphing plots functions where R is a function of q (Chapter 5). Seq (sequence) graphing plots sequences (Chapter 6). Connected, Dot Connected draws a line between the points calculated for the selected functions. Dot plots only the calculated points of the selected functions. Sequential, Simul Sequential graphing evaluates and plots one function completely before the next function is evaluated and plotted. Simul (simultaneous) graphing evaluates and plots all selected functions for a single value of X and then evaluates and plots them for the next value of X. FullScreen, Split FullScreen uses the entire screen to display a graph or edit screen. Split screen displays the current graph on the upper portion of the screen and the Home screen or an editor on the lower portion (Chapter 9). Operating the TI.82 1-11
-
 1
1 -
2
-
3
-
4
-
5
-
6
-
7
-
8
-
9
-
10
-
11
-
12
-
13
-
14
-
15
-
16
-
17
-
18
-
19
-
20
-
21
-
22
-
23
-
24
-
25
-
26
-
27
-
28
-
29
-
 30
30 -
 31
31 -
 32
32 -
 33
33 -
 34
34 -
 35
35 -
 36
36 -
 37
37 -
 38
38 -
 39
39 -
 40
40 -
41
-
42
-
43
-
44
-
45
-
46
-
47
-
48
-
49
-
50
-
51
-
52
-
53
-
54
-
55
-
56
-
57
-
58
-
59
-
60
-
61
-
62
-
63
-
64
-
65
-
66
-
67
-
68
-
69
-
70
-
71
-
72
-
73
-
74
-
75
-
76
-
77
-
78
-
79
-
80
-
81
-
82
-
83
-
84
-
85
-
86
-
87
-
88
-
89
-
90
-
91
-
92
-
93
-
94
-
95
-
96
-
97
-
98
-
99
-
100
-
101
-
102
-
103
-
104
-
105
-
106
-
107
-
108
-
109
-
110
-
111
-
112
-
113
-
114
-
115
-
116
-
117
-
118
-
119
-
120
-
121
-
122
-
123
-
124
-
125
-
126
-
127
-
128
-
129
-
130
-
131
-
132
-
133
-
134
-
135
-
136
-
137
-
138
-
139
-
140
-
141
-
142
-
143
-
144
-
145
-
146
-
147
-
148
-
149
-
150
-
151
-
152
-
153
-
154
-
155
-
156
-
157
-
158
-
159
-
160
-
161
-
162
-
163
-
164
-
165
-
166
-
167
-
168
-
169
-
170
-
171
-
172
-
173
-
174
-
175
-
176
-
177
-
178
-
179
-
180
-
181
-
182
-
183
-
184
-
185
-
186
-
187
-
188
-
189
-
190
-
191
-
192
-
193
-
194
-
195
-
196
-
197
-
198
-
199
-
200
-
201
-
202
-
203
-
204
-
205
-
206
-
207
-
208
-
209
-
210
-
211
-
212
-
213
-
214
-
215
-
216
-
217
-
218
-
219
-
220
-
221
-
222
-
223
-
224
-
225
-
226
-
227
-
228
-
229
-
230
-
231
-
232
-
233
-
234
-
235
-
236
-
237
-
238
-
239
-
240
-
241
-
242
-
243
-
244
-
245
-
246
-
247
-
248
-
249
-
250
-
251
-
252
-
253
-
254
-
255
-
256
-
257
-
258
-
259
-
260
-
261
-
262
-
263
-
264
-
265
-
266
-
267
-
268
-
269
-
270
-
271
-
272
-
273
-
274
-
275
-
276
-
277
-
278
 |
 |