Apple MC172Z/A Administration Guide - Page 179
System Status Icons (Basic)
 |
UPC - 885909323777
View all Apple MC172Z/A manuals
Add to My Manuals
Save this manual to your list of manuals |
Page 179 highlights
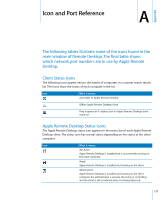
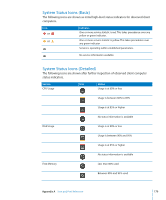
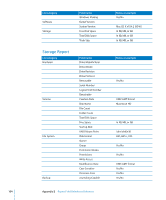
System Status Icons (Basic) The following icons are shown as initial high-level status indicators for observed client computers. Icon or or Indicates One or more service statistic is red. This takes precedence over any yellow or green indicator. One or more service statistic is yellow. This takes precedence over any green indicator Service is operating within established parameters. No service informaiton available. System Status Icons (Detailed) The following icons are shown after further inspection of observed client computer status indicators. Service CPU Usage Icon Status Usage is at 60% or less Usage is between 60% to 85% Usage is at 85% or higher No status information is available DIsk Usage Usage is at 90% or less Usage is between 90% and 95% Usage is at 95% or higher No status information is available Free Memory Less than 80% used Between 80% and 95% used Appendix A Icon and Port Reference 179
-
 1
1 -
2
-
3
-
4
-
5
-
6
-
7
-
8
-
9
-
10
-
11
-
12
-
13
-
14
-
15
-
16
-
17
-
18
-
19
-
20
-
21
-
22
-
23
-
24
-
25
-
26
-
27
-
28
-
29
-
30
-
31
-
32
-
33
-
34
-
35
-
36
-
37
-
38
-
39
-
40
-
41
-
42
-
43
-
44
-
45
-
46
-
47
-
48
-
49
-
50
-
51
-
52
-
53
-
54
-
55
-
56
-
57
-
58
-
59
-
60
-
61
-
62
-
63
-
64
-
65
-
66
-
67
-
68
-
69
-
70
-
71
-
72
-
73
-
74
-
75
-
76
-
77
-
78
-
79
-
80
-
81
-
82
-
83
-
84
-
85
-
86
-
87
-
88
-
89
-
90
-
91
-
92
-
93
-
94
-
95
-
96
-
97
-
98
-
99
-
100
-
101
-
102
-
103
-
104
-
105
-
106
-
107
-
108
-
109
-
110
-
111
-
112
-
113
-
114
-
115
-
116
-
117
-
118
-
119
-
120
-
121
-
122
-
123
-
124
-
125
-
126
-
127
-
128
-
129
-
130
-
131
-
132
-
133
-
134
-
135
-
136
-
137
-
138
-
139
-
140
-
141
-
142
-
143
-
144
-
145
-
146
-
147
-
148
-
149
-
150
-
151
-
152
-
153
-
154
-
155
-
156
-
157
-
158
-
159
-
160
-
161
-
162
-
163
-
164
-
165
-
166
-
167
-
168
-
169
-
170
-
171
-
172
-
173
-
 174
174 -
 175
175 -
 176
176 -
 177
177 -
 178
178 -
 179
179 -
 180
180 -
 181
181 -
 182
182 -
 183
183 -
 184
184 -
185
-
186
-
187
-
188
-
189
-
190
-
191
-
192
-
193
-
194
-
195
-
196
-
197
-
198
-
199
-
200
-
201
-
202
-
203
 |
 |