Compaq ProLiant 1000 Performance Analysis and Tuning of Raptor's Eagle NT 3.06 - Page 14
Tests results with HTTP and FTP Transactions
 |
View all Compaq ProLiant 1000 manuals
Add to My Manuals
Save this manual to your list of manuals |
Page 14 highlights
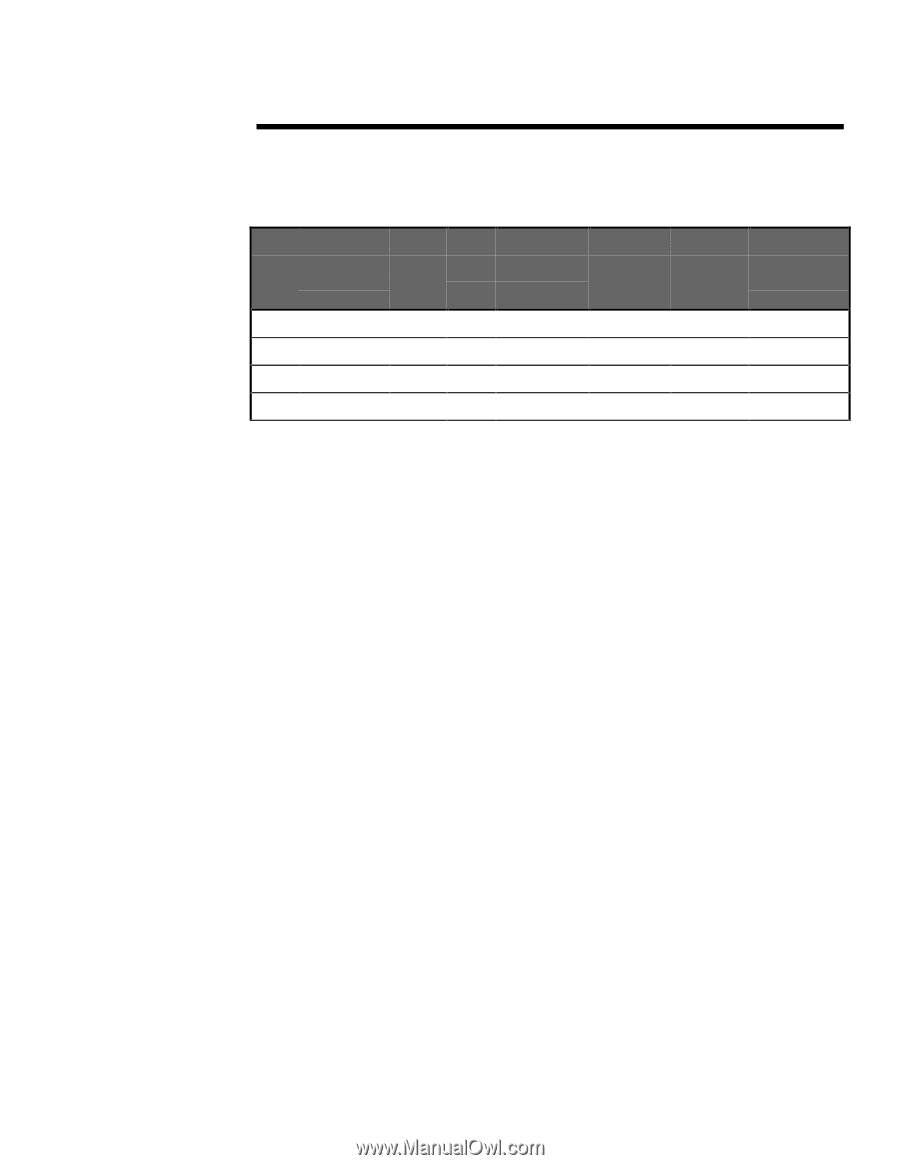
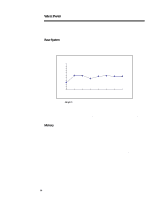
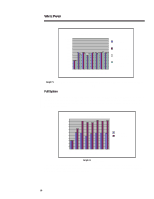
278A/0497 WHITE PAPER (cont.) ... The test runs labeled below correspond to HTTP only tests. These tests are done on the ProLiant 5000. Test 19 is considered as a base system for HTTP only traffic through the firewall. Again the * represents the change from the base system. Run Processor RAM NIC Disk/Drive MaxRecv Network HTTP Type and MHz MB BUS Controller, #Buffers Mb Cache/ DNS Lookup- BUS HTTP/ Rules 19 PP200,512c 64 EISA ON BOARD 100 100 on/on/4 20 PP200,512c 64 EISA ON BOARD 100 100 on/*off/4 21 PP200,512c 64 EISA ON BOARD 100 100 *off/on/4 22 PP200,512c 64 EISA ON BOARD 100 100 on/on/*100 EVALUATION OF RESULTS The results of these benchmark tests are categorized by hardware and software differences from the base system. The results are calculated in transactions per minute for each run. Failures are examined as they provide insight to particular gains or losses. Exactly one hardware or software configuration change is made to the base system for each run. Sets of test runs are completed using different hardware and software configurations each providing a change to the base system. These runs are compared to the base system to determine percent differences between the test runs. Percent differences from transactions per minute differences are then evaluated on a positive and negative basis to show more clearly the affects the particular hardware or software configuration change made to the system. Understanding these positive and negative differences from the base system run explains individual hardware or software performance gains or loses in the system. Sets of individual performance gains or losses can then be assessed to determine what can be done to improve total performance of the firewall. A high-end system was used as the base line for test runs evaluated in this paper, which allowed tests to be run more quickly. Theoretically, the same performance gains or positive percent differences from hardware and software configuration changes used in the high-end system can be achieved using a low-end system as well, providing the firewall software does not change. This allows decisions to be made to increase performance on lower-end systems where it makes sense to have a lower end firewall system such as in small companies, branch offices, or schools. The goals of this section are to provide and explain the results of the test runs and to help the reader gain an understanding of what can be done to improve the performance of the firewall system. This section is broken down into two parts based on test runs with HTTP and FTP transactions and test runs with HTTP only transactions. In both parts, results of the base run are described first, and then the other runs are described and compared to the base run. The results to all of the tests can be found in Appendix B. Tests results with HTTP and FTP Transactions This section first describes the base system results then displays the results and describes the effect that each hardware and software characteristic has on the base system. The ordering of subsections are based on test runs listed in Table 1 and Table 2 of Test Configurations of the Firewall section. Subsections are Base System, Memory, NIC Bus Type, DNS Lookups for HTTPD, HTTPD Cache, MaxRecieve Buffers for NetFlx-3 Cards, Processor, Network Speed, Disk Controller, 100 Firewall Rules, Full System, Other Systems and Configurations. The last 14
-
 1
1 -
2
-
3
-
4
-
5
-
6
-
7
-
8
-
 9
9 -
 10
10 -
 11
11 -
 12
12 -
 13
13 -
 14
14 -
 15
15 -
 16
16 -
 17
17 -
 18
18 -
 19
19 -
20
-
21
-
22
-
23
-
24
-
25
-
26
-
27
 |
 |