Compaq ProLiant 1000 Performance Analysis and Tuning of Raptor's Eagle NT 3.06 - Page 16
NIC Bus Type, DNS Lookups for HTTPD
 |
View all Compaq ProLiant 1000 manuals
Add to My Manuals
Save this manual to your list of manuals |
Page 16 highlights
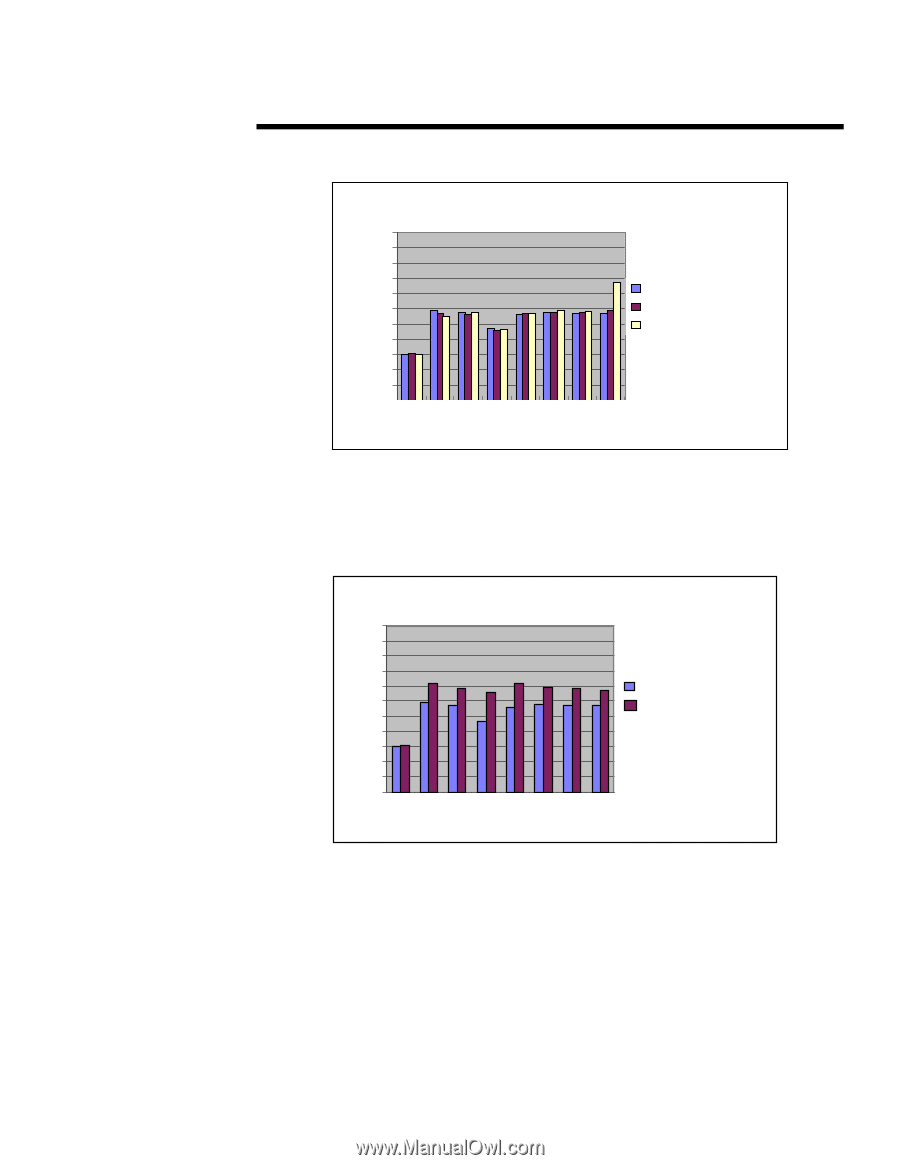
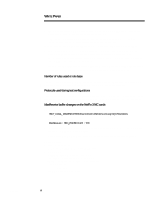
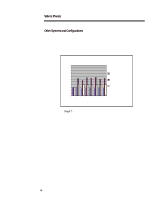
278A/0497 WHITE PAPER (cont.) ... R un #2 and #3 in T PM 1100 1000 900 800 700 600 500 400 300 200 100 0 1 12 24 32 36 48 56 72 V irtual C lients Base Run Base w/128m b R AM Base w/256m b R AM Graph 2: Base Run with 128 MB and 256 MB RAM NIC Bus Type Two PCI NetFlx-3 10/100 NICS replaces two EISA Netflx-3 10/100 for this test. The graph of this run is displayed in Graph 3. 1100 1000 900 800 700 600 500 400 300 200 100 0 Run #4 in TPM 1 12 24 32 36 48 56 72 V irtual C lients Base Run Base + PCI NICs Graph 3: Base Run with PCI NICs The percent difference increase in TPM from the base reached 29% at 32 virtual clients then leveled to around 16% increase from the base system at 72 virtual clients. The burst in TPM at 32 virtual clients to 36 virtual clients comes from garbage cleanup of the firewall system. Improvements are caused from the PCI bus speed being faster than the EISA bus. The average failure rate for all runs is under 1%. DNS Lookups for HTTPD, HTTPD Cache DNS lookups turned off for Run #5 results in an average overall percent increase from the base system in TPM of 4%. Peaks from the base system of 16% to 31% TPM increases are attributed to time just after system cleanup procedures. Since HTTP and FTP are tested in this run there is 16
-
 1
1 -
2
-
3
-
4
-
5
-
6
-
7
-
8
-
9
-
10
-
 11
11 -
 12
12 -
 13
13 -
 14
14 -
 15
15 -
 16
16 -
 17
17 -
 18
18 -
 19
19 -
 20
20 -
 21
21 -
22
-
23
-
24
-
25
-
26
-
27
 |
 |