Compaq ProLiant 1000 Performance Analysis and Tuning of Raptor's Eagle NT 3.06 - Page 19
Full System
 |
View all Compaq ProLiant 1000 manuals
Add to My Manuals
Save this manual to your list of manuals |
Page 19 highlights
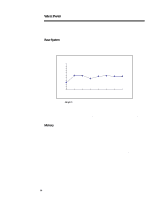
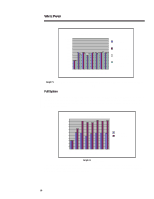
278A/0497 WHITE PAPER (cont.) ... 1100 1000 900 800 700 600 500 400 300 200 100 0 1 Runs #12, #13, and #15 in TPM 12 24 32 36 48 56 72 Virtual Clients Base Run On Board PCI Ctlr S2-Array EISA Raid 0, 1 drive S2-Aray PCI Raid 0, 4 drives Graph 5: Base Run with On Board PCI Ctlr, S2-Array EISA-R0-1D, S2-Array PCI-R04D Full System Run #11 adds a Pentium Pro 200-512K cache processor, 256 MB RAM, sets MaxRecieve buffers for NetFlx-3 cards to 500, changes to PCI bus for NIC cards, and sets DNS Lookups for HTTPD off. Adding these features together shows, the combined performance enhancements. Refer to Graph 6 for the results. 1100 1000 900 800 700 600 500 400 300 200 100 0 1 Run #11 in TPM 12 24 32 36 48 56 72 V irtual C lients Base Run Full System Graph 6: Full System The overall average percentage increase from 1 to 72 virtual clients is 36%. As the load gets higher from 24 to 72 virtual clients the average percentage increase is 44% with peaks of 52% for 32 virtual clients. Failures are less than 0.5%. 19
-
 1
1 -
2
-
3
-
4
-
5
-
6
-
7
-
8
-
9
-
10
-
11
-
12
-
13
-
 14
14 -
 15
15 -
 16
16 -
 17
17 -
 18
18 -
 19
19 -
 20
20 -
 21
21 -
 22
22 -
 23
23 -
 24
24 -
25
-
26
-
27
 |
 |
