Compaq ProLiant 6000 Compaq ProLiant 6000 Power Management using Windows NT Pe - Page 10
Ypical, Upply, Oltage, Urrent, Alues, Urrent
 |
View all Compaq ProLiant 6000 manuals
Add to My Manuals
Save this manual to your list of manuals |
Page 10 highlights
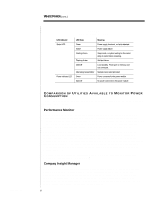
422A/0697ECG WHITE PAPER (cont.) ... The power supply current and voltage values provided in Table 4 can also be used to help determine power availability for each voltage channel. These values can be used in conjunction with performance monitor counters and the information provided in Table 3 to determine the effects of adding additional components to your system. TABLE 4 TYPICAL POWER SUPPLY VOLTAGE, CURRENT, AND POWER VALUES Voltage Range 12.25V +/-2% 5.1V +/- 3% 3.3V +/- 5% Low Range (120V) Full Load Current Limit 20 Amps 32 Amps 18 Amps High Range (240V) Full Load Current Limit 37 Amps 39 Amps 27 Amps Power Limit Low High 245W 163W 59W 453W 199W 89W To make the power wattage per channel data provided in Table 4 more practical for your configuration, you can substitute the output voltage values in Table 4 with the values obtained from the channel voltage performance counter in PerfMon (see Figure 3, page 12). Multiply the voltage by the full load current to get approximate power available per channel for your system when fully loaded. For example: Channel Voltage (V) x Full Load Current (A) = Power Per Channel (W) 12.42V x 20A = 248W The new table values using performance counter data from Figure 3, page 12 are shown in Table 5. TABLE 5 NEW POWER SUPPLY VOLTAGE, CURRENT AND POWER VALUES Voltage Avg. (Value Obtained from PerfMon) 12.45 Volts 5.12 Volts 3.34 Volts Low Range (120V) Full Load Current Limit 20 Amps 32 Amps 18 Amps High Range (240V) Full Load Current Limit 37 Amps 39 Amps 27 Amps Power Low High 249W 164W 60W 461W 200W 90W The new power wattage values can be substituted for the theoretical values provided in Table 6. The new results yield actual power consumption per channel values for the server being used. This provides you with data realistic to your environment to help determine redundancy. 10
-
 1
1 -
2
-
3
-
4
-
 5
5 -
 6
6 -
 7
7 -
 8
8 -
 9
9 -
 10
10 -
 11
11 -
 12
12 -
 13
13 -
 14
14 -
 15
15 -
16
-
17
-
18
-
19
 |
 |
