Dell PowerConnect W-IAP175P Dell Instant 6.1.3.1-3.0.0.0 User Guide - Page 35
Table 2, RF Dashboard
 |
View all Dell PowerConnect W-IAP175P manuals
Add to My Manuals
Save this manual to your list of manuals |
Page 35 highlights
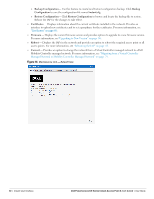
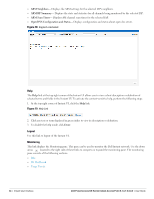
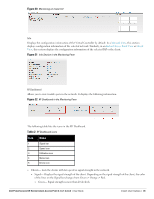
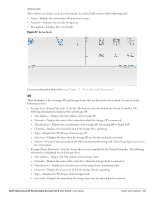
Figure 20 Monitoring on Instant UI Info Displays the configuration information of the Virtual Controller by default. In a Network View, this section displays configuration information of the selected network. Similarly, in an Instant Access Point View or Client View, this section displays the configuration information of the selected IAP or the client. Figure 21 Info Section in the Monitoring Pane RF Dashboard Allows you to view trouble spots in the network. It displays the following information: Figure 22 RF Dashboard in the Monitoring Pane The following table lists the icons in the RF Dashboard. Table 2 RF Dashboard icons Icon Name 1 Signal bar 2 Speed icon 3 Utilization icon 4 Noise icon 5 Errors icon Clients- Lists the clients with low speed or signal strength in the network. Signal- Displays the signal strength of the client. Depending on the signal strength of the client, the color of the lines on the Signal bar changes from Green > Orange > Red. Green- Signal strength is more than 20 decibels. Dell PowerConnect W-Series Instant Access Point 6.1.3.1-3.0.0.0 | User Guide Instant User Interface | 35
-
 1
1 -
2
-
3
-
4
-
5
-
6
-
7
-
8
-
9
-
10
-
11
-
12
-
13
-
14
-
15
-
16
-
17
-
18
-
19
-
20
-
21
-
22
-
23
-
24
-
25
-
26
-
27
-
28
-
29
-
 30
30 -
 31
31 -
 32
32 -
 33
33 -
 34
34 -
 35
35 -
 36
36 -
 37
37 -
 38
38 -
 39
39 -
 40
40 -
41
-
42
-
43
-
44
-
45
-
46
-
47
-
48
-
49
-
50
-
51
-
52
-
53
-
54
-
55
-
56
-
57
-
58
-
59
-
60
-
61
-
62
-
63
-
64
-
65
-
66
-
67
-
68
-
69
-
70
-
71
-
72
-
73
-
74
-
75
-
76
-
77
-
78
-
79
-
80
-
81
-
82
-
83
-
84
-
85
-
86
-
87
-
88
-
89
-
90
-
91
-
92
-
93
-
94
-
95
-
96
-
97
-
98
-
99
-
100
-
101
-
102
-
103
-
104
-
105
-
106
-
107
-
108
-
109
-
110
-
111
-
112
-
113
-
114
-
115
-
116
-
117
-
118
-
119
-
120
-
121
-
122
-
123
-
124
-
125
-
126
-
127
-
128
-
129
-
130
-
131
-
132
-
133
-
134
-
135
-
136
-
137
-
138
-
139
-
140
-
141
-
142
-
143
-
144
-
145
-
146
-
147
-
148
-
149
-
150
-
151
-
152
-
153
-
154
-
155
-
156
-
157
-
158
-
159
-
160
-
161
-
162
-
163
-
164
-
165
-
166
-
167
-
168
-
169
-
170
-
171
-
172
-
173
-
174
-
175
-
176
-
177
-
178
-
179
-
180
-
181
-
182
-
183
-
184
-
185
-
186
-
187
-
188
-
189
-
190
-
191
-
192
-
193
-
194
-
195
-
196
-
197
-
198
-
199
-
200
-
201
-
202
-
203
-
204
-
205
-
206
-
207
-
208
-
209
-
210
-
211
-
212
-
213
-
214
 |
 |
