EMC DS-5100B Hardware Reference - Page 36
Managing the Brocade 5100
 |
View all EMC DS-5100B manuals
Add to My Manuals
Save this manual to your list of manuals |
Page 36 highlights
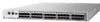
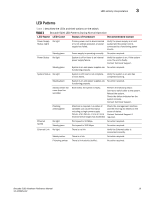
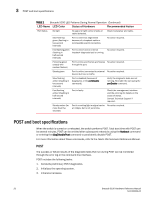
3 Managing the Brocade 5100 2. Use one of the following methods to determine whether a fan requires replacement: • Check the system status LED (see Figure 4 on page 18 for location of system status LED). If the system status LED is flashing amber and green, it could mean the fan has failed. The green power supply/fan LED will also flash in the event of failure. Check the management interface and the error log for details on the cause of status. • In Advanced Web Tools, check the Fan Status icon background color. It will be either yellow or red if the fan has failed. When the fan is functioning correctly, the background color is green. • Type the fanShow command at the command prompt to display fan status as shown below: switch:admin> fanshow Fan 1 is OK, speed is 7105 RPM Fan 2 is OK, speed is 7258 RPM For further information on replacing the power/fan units, see the Brocade 5100 Power Supply and Fan Assembly Replacement Procedure. Managing the Brocade 5100 You can use the management functions built into the Brocade 5100 to monitor the fabric topology, port status, physical status, and other information to help you analyze switch performance and to accelerate system debugging. The Brocade 5100 automatically performs power-on-self-test (POST) each time it is turned on. Any errors are recorded in the error log. For more information about POST, see "POST and boot specifications" on page 20. For information about upgrading the version of Fabric OS installed on your switch, refer to the Fabric OS Administrator's Guide. You can manage the Brocade 5100 using any of the management options listed in Table 2. TABLE 2 Management Options for the Brocade 5100 Switch Management Tool Out-of-band Support In-band Support Command line interface (CLI) Up to two admin sessions and four user sessions simultaneously. For more information, refer to the Fabric OS Administrator's Guide and the Fabric OS Command Reference Manual. Ethernet or serial connection Brocade Web Tools For information, refer to the Web Tools Administrator's Guide. Ethernet or serial connection Standard SNMP applications For information, refer to the MIB Reference Manual. Ethernet or serial connection Brocade Fabric Manager (option to purchase) Ethernet or serial For information, refer to the Fabric Manager Administrator's Guide. connection Management Server For information, refer to the Fabric OS Administrator's Guide and the Fabric OS Command Reference Manual. Ethernet or serial connection EFCM (option to purchase) For information, refer to the EFCM documentation set. Ethernet or serial connection IP over Fibre Channel IP over Fibre Channel IP over Fibre Channel IP over Fibre Channel Native in-band interface (over HBA only) IP over Fibre Channel 24 Brocade 5100 Hardware Reference Manual 53-1000854-02
-
 1
1 -
2
-
3
-
4
-
5
-
6
-
7
-
8
-
9
-
10
-
11
-
12
-
13
-
14
-
15
-
16
-
17
-
18
-
19
-
20
-
21
-
22
-
23
-
24
-
25
-
26
-
27
-
28
-
29
-
30
-
 31
31 -
 32
32 -
 33
33 -
 34
34 -
 35
35 -
 36
36 -
 37
37 -
 38
38 -
 39
39 -
 40
40 -
 41
41 -
42
-
43
-
44
-
45
-
46
-
47
-
48
-
49
-
50
-
51
-
52
-
53
-
54
 |
 |
