Garmin ECHOMAP Plus 42cv Owners Manual PDF - Page 12
Premium Charts
 |
View all Garmin ECHOMAP Plus 42cv manuals
Add to My Manuals
Save this manual to your list of manuals |
Page 12 highlights
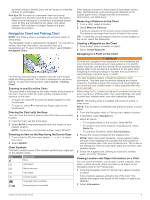
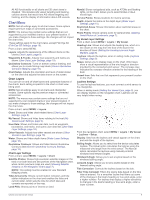
Viewing Details about Navaids From the Navigation chart, Fishing chart, Perspective 3D chart view, or Mariner's Eye 3D chart view, you can view details about various types of navigation aids, including beacons, lights, and obstructions. NOTE: The Fishing chart is available with premium charts, in some areas. NOTE: 3D chart views are available with premium charts, in some areas. 1 From a chart or 3D chart view, select a navaid. 2 Select the name of the navaid. Heading Line and Angle Markers The heading line is an extension drawn on the map from the bow of the boat in the direction of travel. Angle markers indicate relative position from the heading or course over ground, which are helpful for casting or finding reference points. Setting the Heading Line and Angle Markers The heading line is an extension drawn on the map from the bow of the boat in the direction of travel. Angle markers indicate relative position from the heading or course over ground, which are helpful for casting or finding reference points. You can show the heading line and the course over ground (COG) line on the chart. COG is your direction of movement. Heading is the direction the bow of the boat is pointed, when a heading sensor is connected. 1 From a chart, select MENU > Layers > My Vessel > Heading Line. 2 Angle Markers 3 If necessary, select Source, and select an option: • To automatically use the available source, select Auto. • To use the GPS antenna heading for COG, select GPS Heading (COG). • To use data from a connected heading sensor, select Heading. • To use data from both a connected heading sensor and the GPS antenna, select COG and Heading. This displays both the heading line and the COG line on the chart. 4 Select Display, and select an option: • Select Distance > Distance, and enter the length of the line shown on the chart. • Select Time > Time, and enter the time used to calculate the distance your boat will travel in the specified time at your present speed. Turning on Angle Markers You can add angle markers to the map along the heading line. Angle markers can be helpful for casting when fishing. 1 Set the heading line (Setting the Heading Line and Angle Markers, page 6). 2 Select Angle Markers. Premium Charts WARNING All route and navigation lines displayed on the chartplotter are only intended to provide general route guidance or to identify proper channels, and are not intended to be precisely followed. Always defer to the navaids and conditions on the water when navigating to avoid groundings or hazards that could result in vessel damage, personal injury, or death. The Auto Guidance feature is based on electronic chart information. That data does not ensure obstacle and bottom clearance. Carefully compare the course to all visual sightings, and avoid any land, shallow water, or other obstacles that may be in your path. NOTE: Not all models support all charts. Optional premium charts, such as BlueChart® g3 Vision, allow you to get the most out of your chartplotter. In addition to detailed marine charting, premium charts may contain these features, which are available in some areas. Mariner's Eye 3D: Provides a view from above and behind the boat for a three-dimensional navigation aid. Fish Eye 3D: Provides an underwater, three-dimensional view that visually represents the sea floor according to the information on the chart. Fishing Charts: Shows the chart with enhanced bottom contours and without navigational data. This chart works well for offshore deep-sea fishing. High Resolution Satellite Imagery: Provides high-resolution satellite images for a realistic view of the land and water on the Navigation chart (Showing Satellite Imagery on the Navigation Chart, page 7). Aerial Photos: Shows marinas and other navigationally significant aerial photos to help you visualize your surroundings (Viewing Aerial Photos of Landmarks, page 7). Detailed Roads and POI data: Shows detailed road and point of interest (POI) data, which includes highly detailed coastal roads and POIs such as restaurants, lodging, and local attractions. Auto Guidance: Uses specified information about your vessel and chart data to determine the best path to your destination. Viewing Tide Station Information on the chart indicates a tide station. You can view a detailed graph for a tide station to help predict the tide level at different times or on different days. NOTE: This feature is available with premium charts, in some areas. 1 From the Navigation chart or Fishing chart, select a tide station. Tide direction and tide level information appear near . 2 Select the station name. Animated Tide and Current Indicators NOTE: This feature is available with premium charts, in some areas. You can view indicators for animated tide station and current direction on the Navigation chart or the Fishing chart. You must also enable animated icons in the chart settings (Chart Layer Settings, page 9). An indicator for a tide station appears on the chart as a vertical bar graph with an arrow. A red arrow pointing downward indicates a falling tide, and a blue arrow pointing upward indicates a rising tide. When you move the cursor over the tide station indicator, the height of the tide at the station appears above the station indicator. Current direction indicators appear as arrows on the chart. The direction of each arrow indicates the direction of the current at a specific location on the chart. The color of the current arrow indicates the range of speed for the current at that location. When you move the cursor over the current direction indicator, the specific current speed at the location appears above the direction indicator. Color Yellow Orange Red Current Speed Range 0 to 1 knot 1 to 2 knots 2 or more knots 6 Charts and 3D Chart Views
-
 1
1 -
2
-
3
-
4
-
5
-
6
-
 7
7 -
 8
8 -
 9
9 -
 10
10 -
 11
11 -
 12
12 -
 13
13 -
 14
14 -
 15
15 -
 16
16 -
 17
17 -
18
-
19
-
20
-
21
-
22
-
23
-
24
-
25
-
26
-
27
-
28
-
29
-
30
-
31
-
32
-
33
-
34
-
35
-
36
-
37
-
38
-
39
-
40
-
41
-
42
-
43
-
44
-
45
-
46
-
47
-
48
-
49
-
50
-
51
-
52
-
53
-
54
 |
 |
