Garmin ECHOMAP Plus 42cv Owners Manual PDF - Page 16
Supported Maps
 |
View all Garmin ECHOMAP Plus 42cv manuals
Add to My Manuals
Save this manual to your list of manuals |
Page 16 highlights
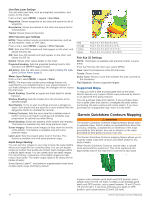
User Data Layer Settings You can show user data, such as waypoints, boundaries, and tracks, on the charts. From a chart, select MENU > Layers > User Data. Waypoints: Shows waypoints on the chart and opens the list of waypoints. Boundaries: Shows boundaries on the chart and opens the list of boundaries. Tracks: Shows tracks on the chart. Other Vessels Layer Settings NOTE: These options require connected accessories, such as an AIS receiver, radar, or VHF radio. From a chart, select MENU > Layers > Other Vessels. DSC: Sets how DSC vessels and trails appear on the chart, and shows the DSC list. AIS: Sets how AIS vessels and trails appear on the chart, and shows the AIS list. Details: Shows other vessel details on the chart. Projected Heading: Sets the projected heading time for AIS- activated and MARPA-tagged vessels. AIS Alarm: Sets the safe-zone collision alarm (Setting the Safe- Zone Collision Alarm, page 8). Water Layer Settings From a chart, select MENU > Layers > Water. NOTE: The menu may contain some settings that are not supported by your installed charts or your present location. If you make changes to those settings, the changes will not impact the chart view. Depth Shading: Specifies an upper and lower depth to shade between. Shallow Shading: Sets the shades from the shoreline to the specified depth. Spot Depths: Turns on spot soundings and sets a dangerous depth. Spot depths that are equal to or more shallow than the dangerous depth are indicated by red text. Fishing Contours: Sets the zoom level for a detailed view of bottom contours and depth soundings and simplifies map presentation for optimal use while fishing. Relief Shading: Shows the gradient of the bottom with shading. This feature is available only with some premium maps. Sonar Imagery: Shows sonar imagery to help show the density of the bottom. This feature is available only with some premium maps. Lake Level: Sets the present water level of the lake. This feature is available only with some premium maps. Depth Range Shading You can set color ranges on your map to show the water depths where your target fish are currently biting. You can set deeper ranges to monitor how quickly the bottom depth changes within a specific depth range. You can create up to ten depth ranges. For inland fishing, a maximum of five depth ranges can help reduce map clutter. The depth ranges apply to all charts and all bodies of water. Some Garmin LakeVü™ and premium supplemental charts have multiple depth range shading by default. Red Orange Yellow Green From 0 to 1.5 m (from 0 to 5 ft.) From 1.5 to 3 m (from 5 to 10 ft.) From 3 to 4.5 m (from 10 to 15 ft.) From 4.5 to 7.6 m (from 15 to 25 ft.) Fish Eye 3D Settings NOTE: This feature is available with premium charts, in some areas. From the Fish Eye 3D chart view, select MENU. View: Sets the perspective of the 3D chart view. Tracks: Shows tracks. Sonar Cone: Shows a cone that indicates the area covered by the transducer. Fish Symbols: Shows suspended targets. Supported Maps To help you have a safe and enjoyable time on the water, Garmin devices only support official maps produced by Garmin or an approved third party producer. You can purchase maps from Garmin. If you purchase maps from a seller other than Garmin, investigate the seller before purchasing. Be extra cautious with online sellers. If you have purchased an unsupported map, return it to the seller. Garmin Quickdraw Contours Mapping WARNING The Garmin Quickdraw Contours mapping feature allows users to generate maps. Garmin makes no representations about the accuracy, reliability, completeness or timeliness of the maps generated by third parties. Any use or reliance on the maps generated by third parties is at your own risk. The Garmin Quickdraw Contours mapping feature allows you to instantly create maps with contours and depth labels for any body of water. When Garmin Quickdraw Contours records data, a colored circle surrounds the vessel icon. This circle represents the approximate area of the map that is scanned by each pass. A green circle indicates good depth and GPS position, and a speed under 16 km/h (10 mph). A yellow circle indicates good depth and GPS position, and a speed between 16 and 32 km/h (10 and 20 mph). A red circle indicates poor depth or GPS position, and a speed above 32 km/h (20 mph). 10 Garmin Quickdraw Contours Mapping
-
 1
1 -
2
-
3
-
4
-
5
-
6
-
7
-
8
-
9
-
10
-
 11
11 -
 12
12 -
 13
13 -
 14
14 -
 15
15 -
 16
16 -
 17
17 -
 18
18 -
 19
19 -
 20
20 -
 21
21 -
22
-
23
-
24
-
25
-
26
-
27
-
28
-
29
-
30
-
31
-
32
-
33
-
34
-
35
-
36
-
37
-
38
-
39
-
40
-
41
-
42
-
43
-
44
-
45
-
46
-
47
-
48
-
49
-
50
-
51
-
52
-
53
-
54
 |
 |
