Garmin aera 560 Pilot's Guide - Page 102
SURFACE PRESSURE, pressure areas are generally associated with clouds and the chance of precipitation.
 |
View all Garmin aera 560 manuals
Add to My Manuals
Save this manual to your list of manuals |
Page 102 highlights
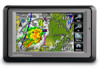
Overview Hazard Avoidance Sunny Partly Cloudy Mostly Cloudy Cloudy Thunderstorms Rain Freezing Rain Snow Windy Haze Foggy Very Cold Forecast Legend Very Hot GPS Navigation Additional Features Hazard Avoidance Flight Planning Appendices Fronts Legend Surface Pressure This feature displays pressure isobars and pressure centers. The isobars connect points of equal pressure. Pressure readings can help determine weather and wind conditions. High pressure areas are generally associated with fair weather. Low pressure areas are generally associated with clouds and the chance of precipitation. Isobars that are packed closely together show a strong pressure gradient. Strong gradients are associated with areas of stronger winds. Pressure units can be displayed in Millibars (mb) and Inches of Mercury (in). Surface Pressure Data 90 Garmin aera 500 Series Pilot's Guide 190-01117-02 Rev. A Index
-
 1
1 -
2
-
3
-
4
-
5
-
6
-
7
-
8
-
9
-
10
-
11
-
12
-
13
-
14
-
15
-
16
-
17
-
18
-
19
-
20
-
21
-
22
-
23
-
24
-
25
-
26
-
27
-
28
-
29
-
30
-
31
-
32
-
33
-
34
-
35
-
36
-
37
-
38
-
39
-
40
-
41
-
42
-
43
-
44
-
45
-
46
-
47
-
48
-
49
-
50
-
51
-
52
-
53
-
54
-
55
-
56
-
57
-
58
-
59
-
60
-
61
-
62
-
63
-
64
-
65
-
66
-
67
-
68
-
69
-
70
-
71
-
72
-
73
-
74
-
75
-
76
-
77
-
78
-
79
-
80
-
81
-
82
-
83
-
84
-
85
-
86
-
87
-
88
-
89
-
90
-
91
-
92
-
93
-
94
-
95
-
96
-
 97
97 -
 98
98 -
 99
99 -
 100
100 -
 101
101 -
 102
102 -
 103
103 -
 104
104 -
 105
105 -
 106
106 -
 107
107 -
108
-
109
-
110
-
111
-
112
-
113
-
114
-
115
-
116
-
117
-
118
-
119
-
120
-
121
-
122
-
123
-
124
-
125
-
126
-
127
-
128
-
129
-
130
-
131
-
132
-
133
-
134
-
135
-
136
-
137
-
138
-
139
-
140
-
141
-
142
-
143
-
144
-
145
-
146
-
147
-
148
-
149
-
150
-
151
-
152
-
153
-
154
-
155
-
156
-
157
-
158
-
159
-
160
-
161
-
162
-
163
-
164
-
165
-
166
-
167
-
168
-
169
-
170
-
171
-
172
-
173
-
174
-
175
-
176
-
177
-
178
-
179
-
180
-
181
-
182
-
183
-
184
-
185
-
186
-
187
-
188
-
189
-
190
-
191
-
192
-
193
-
194
-
195
-
196
-
197
-
198
-
199
-
200
-
201
-
202
 |
 |
