Campbell Scientific 253 253-L and 257-L (Watermark 200) Soil Matric Potential - Page 22
Edlog Dataloggers
 |
View all Campbell Scientific 253 manuals
Add to My Manuals
Save this manual to your list of manuals |
Page 22 highlights
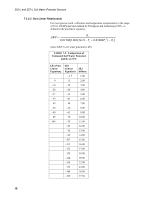
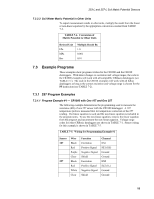
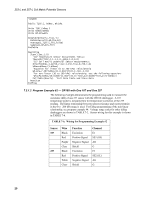
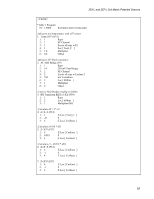
253-L and 257-L Soil Matric Potential Sensors TABLE 7-1 shows the excitation and voltage ranges used with the CRBasic dataloggers. TABLE 7-1. Excitation and Voltage Ranges for CRBasic Dataloggers Datalogger CR800 Series CR1000 CR3000 CR5000 CR9000(X) mV excitation 250 250 200 200 200 Full Scale Range ± 250 mV ± 250 mV ± 200 mV ± 200 mV ± 200 mV 7.2.1.2 Resistance Calculation Sensor resistance is calculated with a CRBasic expression. If the result of the BRHalf() instruction is assigned to a variable called kOhms, then the resistance would be determined with the expression: kOhms = 1 * (kOhms/(1-kOhms)) where the 1 represents the value of the reference resistor in kOhms and can be omitted from the expression if desired. 7.2.2 Edlog Dataloggers 7.2.2.1 Program Instruction 5 Edlog dataloggers use Instruction 5, AC Half Bridge (P5), to excite and measure the 253 and 257. Recommended excitation voltages and input ranges for Edlog dataloggers are listed in TABLE 7-2. TABLE 7-2. Excitation and Voltage Ranges for Edlog Dataloggers Datalogger 21X CR10(X) CR510/CR500 CR23X CR7 mV excitation 500 250 250 200 500 Range Code 14 14 14 13 16 Full Scale Range ± 500 mV ± 250 mV ± 250 mV ± 200 mV ± 500 mV 7.2.2.2 Program Instruction 59 Instruction 59, Bridge Transform (P59), is used to output sensor resistance (Rs). The instruction takes the AC Half Bridge output (Vs/Vx) and computes the sensor resistance as follows: 16
-
 1
1 -
2
-
3
-
4
-
5
-
6
-
7
-
8
-
9
-
10
-
11
-
12
-
13
-
14
-
15
-
16
-
 17
17 -
 18
18 -
 19
19 -
 20
20 -
 21
21 -
 22
22 -
 23
23 -
 24
24 -
 25
25 -
 26
26 -
 27
27 -
28
-
29
-
30
-
31
-
32
-
33
-
34
-
35
-
36
 |
 |
