Dell PowerEdge C4140 Deep Learning Performance Comparison - Scale-up vs. Scale - Page 23
Performance Results
 |
View all Dell PowerEdge C4140 manuals
Add to My Manuals
Save this manual to your list of manuals |
Page 23 highlights
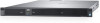
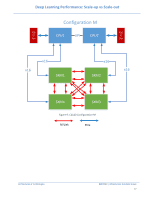
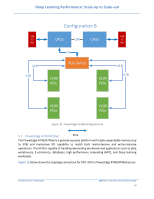
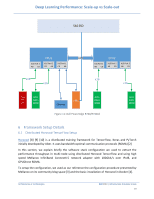
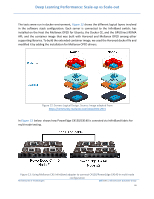
Deep Learning Performance: Scale-up vs Scale-out 7 Performance Results 7.1 Single Node - Throughput (images/sec) The charts below show the results for different servers running the short tests to extract throughput images/second using ResNet50 with batch size 128 and number of steps =100. The results for single node are with maximum number of GPUs supported within that node. 7.1.1 PowerEdge R740xd Figure 15: PowerEdge R740-P40 server with up to 3 GPUs The PowerEdge R740 with P40 GPU is tested with different pre-trained neural models. The results show how different models use the amount of available memory e.g. ResNet50 uses more memory than GoogLeNet or AlexNet and therefore we see lower throughput. Architectures & Technologies Dell EMC | Infrastructure Solutions Group 22
-
 1
1 -
2
-
3
-
4
-
5
-
6
-
7
-
8
-
9
-
10
-
11
-
12
-
13
-
14
-
15
-
16
-
17
-
 18
18 -
 19
19 -
 20
20 -
 21
21 -
 22
22 -
 23
23 -
 24
24 -
 25
25 -
 26
26 -
 27
27 -
 28
28 -
29
-
30
-
31
-
32
-
33
-
34
-
35
-
36
-
37
-
38
-
39
-
40
-
41
-
42
-
43
-
44
-
45
-
46
-
47
-
48
-
49
-
50
-
51
-
52
-
53
 |
 |
