Dell PowerEdge C4140 Deep Learning Performance Comparison - Scale-up vs. Scale - Page 9
Dell PowerEdge C4140 Manual
 |
View all Dell PowerEdge C4140 manuals
Add to My Manuals
Save this manual to your list of manuals |
Page 9 highlights
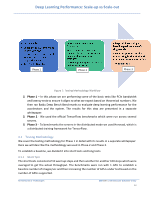
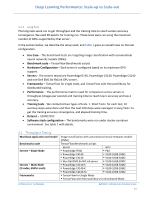
Deep Learning Performance: Scale-up vs Scale-out The plot in Figure 3 shows GPU performance when looking at single precision and Figure 4 shows GPU performance when looking at half-precision. Most of the Deep Learning frameworks and models take advantage of half-precision since they can work with larger datasets with the available memory. It's very important to look at the raw Flop numbers for a GPU, since we want to extract the same level of performance when that GPU is put into a system. Figure 3 NVidia GPU Performance - Single precision [7] Architectures & Technologies Dell EMC | Infrastructure Solutions Group 8
-
 1
1 -
2
-
3
-
 4
4 -
 5
5 -
 6
6 -
 7
7 -
 8
8 -
 9
9 -
 10
10 -
 11
11 -
 12
12 -
 13
13 -
 14
14 -
15
-
16
-
17
-
18
-
19
-
20
-
21
-
22
-
23
-
24
-
25
-
26
-
27
-
28
-
29
-
30
-
31
-
32
-
33
-
34
-
35
-
36
-
37
-
38
-
39
-
40
-
41
-
42
-
43
-
44
-
45
-
46
-
47
-
48
-
49
-
50
-
51
-
52
-
53
 |
 |

Deep Learning Performance: Scale-up vs Scale-out
Architectures & Technologies
Dell
EMC
| Infrastructure Solutions Group
8
The plot in
Figure 3
shows GPU performance when looking at single precision and
Figure 4
shows GPU performance when looking at half-precision. Most of the Deep Learning frameworks
and models take advantage of half-precision since they can work with larger datasets with the
available memory.
It’s
very important to look at the raw Flop numbers for a GPU, since we want
to extract the same level of performance when that GPU is put into a system.
Figure 3 NVidia GPU Performance - Single precision
[7]