Dell PowerVault MD3000i Dell PowerVault MD3000/MD3000i Array Tuning Best Pract - Page 14
Tuning Using Array Performance Data
 |
View all Dell PowerVault MD3000i manuals
Add to My Manuals
Save this manual to your list of manuals |
Page 14 highlights
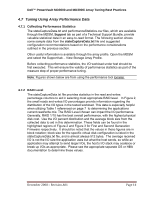
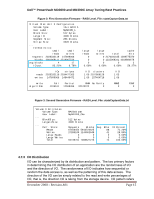
Dell™ PowerVault MD3000 and MD3000i Array Tuning Best Practices 4.7 Tuning Using Array Performance Data 4.7.1 Collecting Performance Statistics The stateCaptureData.txt and performanceStatistics.csv files, which are available through the MDSM, Support tab as part of a Technical Support Bundle, provide valuable statistical data in an easy-to-read format. The following section shows some sample data from the stateCaptureData.txt file and suggested configuration recommendations based on the performance considerations outlined in the previous section. Other useful information is available through the array profile. Open the MDSM and select the Support tab - View Storage Array Profile. Before collecting performance statistics, the I/O workload under test should be first executed. This will ensure the validity of performance statistics as part of the measure step of proper performance tuning. Note: Figures shown below are from using the performance tool Iometer. 4.7.2 RAID Level The stateCaptureData.txt file provides statistics in the read and writes percentage columns to aid in selecting most appropriate RAID level. In Figure 2, the small reads and writes I/O percentages provide information regarding the distribution of the I/O types in the tested workload. This data is especially helpful when utilizing Table 1 referenced on page 7 to determining the applications current read/write mix. The RAID Level chosen can impact the I/O performance. Generally, RAID 1/10 has the best overall performance, with the highest physical disk cost. Use the I/O percent distribution and the average block size from the collected data to aid in this determination. These fields can be found in the highlighted regions of Figure 2 and Figure 3 for First and Second Generation Firmware respectively. It should be noted that the values in these figures are in block notation; block size for the specific virtual disk configuration is listed in the stateCaptureData.txt file, and is almost always 512 bytes. The average received I/O is not the I/O size the application uses but what the host sends, so while an application may attempt to send larger I/Os, the host's I/O stack may coalesce or break up I/Os as appropriate. Please see the appropriate separate OS or HBA documentation to determine these values. December 2008 - Revision A01 Page 14
-
 1
1 -
2
-
3
-
4
-
5
-
6
-
7
-
8
-
 9
9 -
 10
10 -
 11
11 -
 12
12 -
 13
13 -
 14
14 -
 15
15 -
 16
16 -
 17
17 -
 18
18 -
 19
19 -
20
-
21
-
22
-
23
-
24
-
25
-
26
-
27
-
28
-
29
-
30
-
31
-
32
 |
 |
