Fluke 125B/S Calibration Guide - Page 13

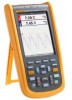
Dual Input Meter, Trigger, Advanced Scope Functions, Input A and Input B

Page 13 highlights

Industrial ScopeMeter Specifications Time Base Accuracy Equivalent sampling 0.4 % + 0.025 time/div) Real time sampling 0.1 % + 0.025 time/div) Glitch Detection 25 ns @ 20 ns to 60 s/div Horizontal Move 12 divisions, trigger point can be positioned anywhere across the screen Trigger Screen Update Free Run, On Trigger Source A, B Sensitivity A and B @ DC to 5 MHz 0.5 divisions or 5 mV @ 40 MHz 125B, 124B 1.5 divisions 123B 4 divisions @ 60 MHz 125B, 124B 4 divisions 123B NA Slope Positive, Negative Advanced Scope Functions Display Modes Normal Captures up to 25 ns glitches and displays analog-like persistence waveform. Glitch Off Does not capture glitches between samples. Smooth Suppresses noise from a waveform. Envelope Records and displays the minimum and maximum of waveforms over time. Auto Set (Connect-and-View) Continuous fully automatic adjustments of amplitude, time base, trigger levels, trigger gap, and hold-off. Manual override by user adjustment of amplitude, time base, or trigger level. Dual Input Meter The accuracy of all measurements is within ±(% of reading + number of counts) from 18 °C to 28 °C. Add 0.1x (specific accuracy) for each °C below 18 °C or above 28 °C. For voltage measurements with 10:1 probe, add probe uncertainty +1 %. More than one waveform period must be visible on the screen. Input A and Input B DC Voltage (VDC) Ranges 500 mV, 5 V, 50 V, 500 V, 750 V Accuracy 0.5 % + 5 counts) Normal Mode Rejection (SMR 60 dB @ 50 Hz or 60 Hz ±0.1 % Common Mode Rejection (CMRR 100 dB @ DC >60 dB @ 50 Hz, 60 Hz, or 400 Hz Full Scale Reading 5000 counts True RMS Voltages (VAC and VAC+DC) Ranges 500 mV, 5 V, 50 V, 500 V, 750 V Accuracy for 5 % to 100 % of range DC coupled DC to 60 Hz (VAC+DC 1 % + 10 counts) 1 Hz to 60 Hz (VAC 1 % + 10 counts) AC or DC coupled 60 Hz to 20 kHz 2.5 % + 15 counts) 20 kHz to 1 MHz 5 % + 20 counts) 1 MHz to 5 MHz 10 % + 25 counts) 5 MHz to 12.5 MHz 30 % + 25 counts) 5 MHz to 20 MHz (without test leads or probes 30 % + 25 counts) 5

  • 1
  • 2
  • 3
  • 4
  • 5
  • 6
  • 7
  • 8
  • 9
  • 10
  • 11
  • 12
  • 13
  • 14
  • 15
  • 16
  • 17
  • 18
  • 19
  • 20
  • 21
  • 22
  • 23
  • 24
  • 25
  • 26
  • 27
  • 28
  • 29
  • 30
  • 31
  • 32
  • 33
  • 34
  • 35
  • 36
  • 37
  • 38
  • 39
  • 40
  • 41
  • 42
  • 43
  • 44
  • 45
  • 46
  • 47
  • 48
  • 49
  • 50
  • 51
  • 52
  • 53
  • 54

Industrial ScopeMeter
Specifications
5
Time Base Accuracy
Equivalent sampling
.................................................
±
(0.4 % + 0.025 time/div)
Real time sampling
...................................................
±
(0.1 % + 0.025 time/div)
Glitch Detection
..........................................................
25 ns @ 20 ns to 60 s/div
Horizontal Move
....................................................
12 divisions, trigger point can be positioned anywhere across the screen
Trigger
Screen Update
.......................................................
Free Run, On Trigger
Source
....................................................................
A, B
Sensitivity A and B
@ DC to 5 MHz
...................................................
0.5 divisions or 5 mV
@ 40 MHz
125B, 124B
.....................................................
1.5 divisions
123B
................................................................
4 divisions
@ 60 MHz
125B, 124B
.....................................................
4 divisions
123B
................................................................
NA
Slope
......................................................................
Positive, Negative
Advanced Scope Functions
Display Modes
Normal
................................................................
Captures up to 25 ns glitches and displays analog-like persistence waveform.
Glitch Off
.............................................................
Does not capture glitches between samples.
Smooth
................................................................
Suppresses noise from a waveform.
Envelope
.............................................................
Records and displays the minimum and maximum of waveforms over time.
Auto Set (Connect-and-View
)
Continuous fully automatic adjustments of amplitude, time base, trigger levels, trigger gap, and hold-off. Manual override by user
adjustment of amplitude, time base, or trigger level.
Dual Input Meter
The accuracy of all measurements is within
±
(% of reading + number of counts) from 18
°
C to 28
°
C.
Add 0.1x (specific accuracy) for each
°
C below 18
°
C or above 28
°
C. For voltage measurements with 10:1 probe, add probe
uncertainty +1 %. More than one waveform period must be visible on the screen.
Input A and Input B
DC Voltage (VDC)
Ranges
................................................................
500 mV, 5 V, 50 V, 500 V, 750 V
Accuracy
....................................................................
±
(0.5 % + 5 counts)
Normal Mode Rejection (SMR)
...........................
>60 dB @ 50 Hz or 60 Hz
±
0.1 %
Common Mode Rejection (CMRR)
.....................
>100 dB @ DC
>60 dB @ 50 Hz, 60 Hz, or 400 Hz
Full Scale Reading
..............................................
5000 counts
True RMS Voltages (VAC and VAC+DC)
Ranges
................................................................
500 mV, 5 V, 50 V, 500 V, 750 V
Accuracy for 5 % to 100 % of range
DC coupled
DC to 60 Hz (VAC+DC)
...............................
±
(1 % + 10 counts)
1 Hz to 60 Hz (VAC)
.....................................
±
(1 % + 10 counts)
AC or DC coupled
60 Hz to 20 kHz
.............................................
±
(2.5 % + 15 counts)
20 kHz to 1 MHz
............................................
±
(5 % + 20 counts)
1 MHz to 5 MHz
.............................................
±
(10 % + 25 counts)
5 MHz to 12.5 MHz
.......................................
±
(30 % + 25 counts)
5 MHz to 20 MHz
(without test leads or probes)
...................
±(30 % + 25 counts)