Garmin GPSMAP 292 Owner's Manual - Page 46
Tide Tab, U.S.A. coastline, Alaska, Hawaii, western Canada, and several
 |
View all Garmin GPSMAP 292 manuals
Add to My Manuals
Save this manual to your list of manuals |
Page 46 highlights
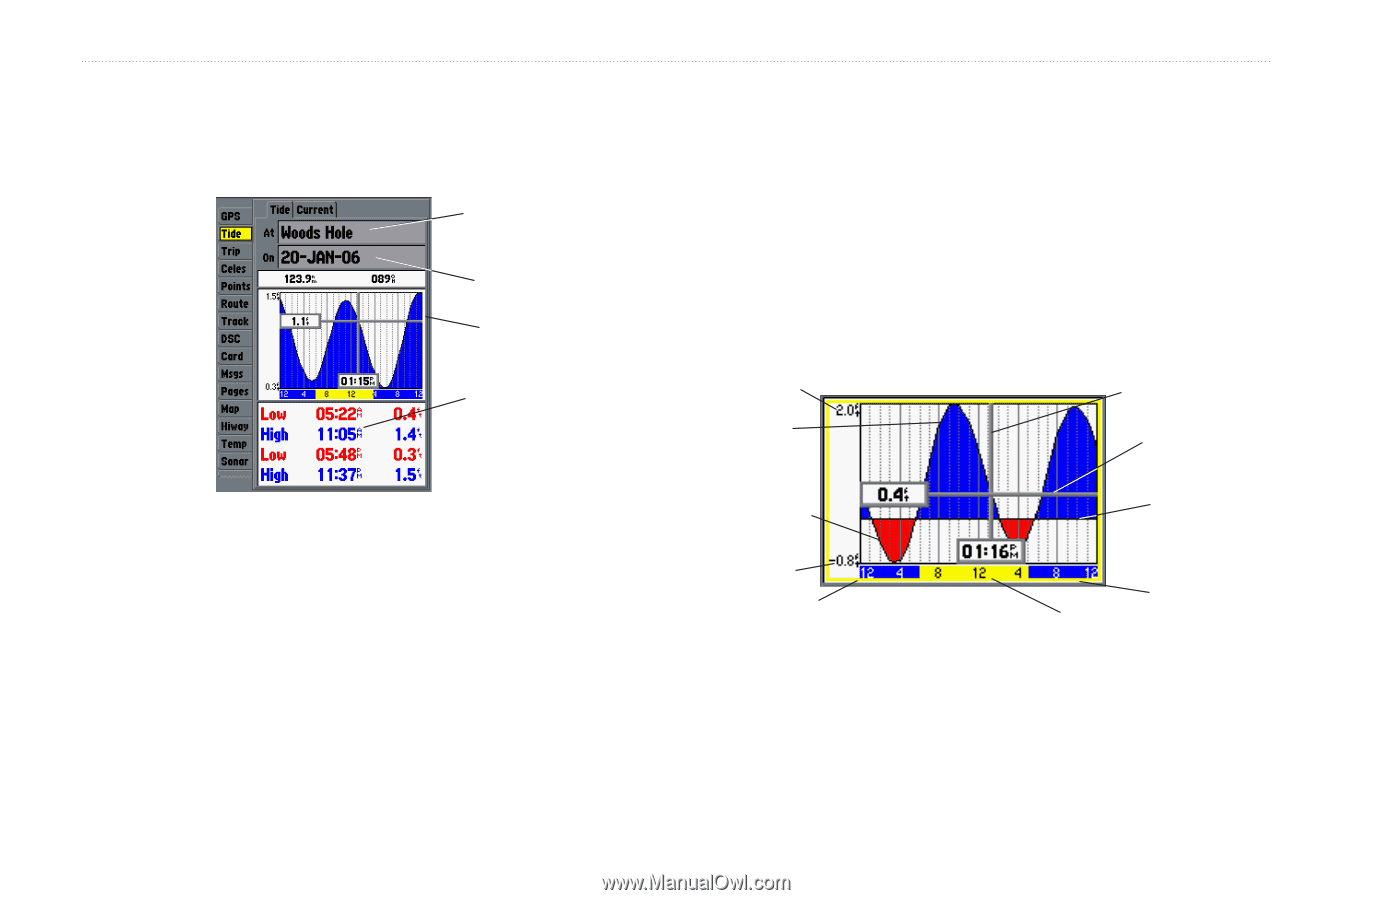
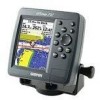
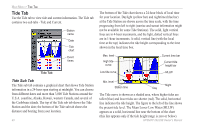
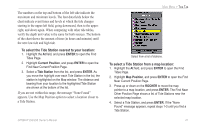
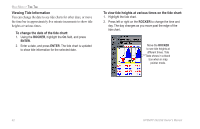
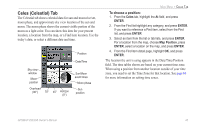
MAIN MENU > TIDE TAB Tide Tab Use the Tide tab to view tide and current information. The Tide tab contains two sub tabs - Tide and Current. Station name Date Tide chart Event times Tide Tab Tide Sub Tab The Tide sub tab contains a graphical chart that shows Tide Station information in a 24-hour span starting at midnight. You can choose from different dates and more than 3,000 Tide Stations around the U.S.A. coastline, Alaska, Hawaii, western Canada, and several of the Caribbean islands. The top of the Tide sub tab shows the Tide Station and the date; the bottom of the Tide sub tab shows the distance and bearing from your location. 40 The bottom of the Tide chart shows a 24-hour block of local time for your location. Daylight (yellow bar) and nighttime (blue bar) at the Tide Station are shown across the time scale, with the time progressing from left to right (sunrise and sunset information might not be available for some Tide Stations). The solid, light vertical lines are in 4-hour increments, and the light, dotted vertical lines are in 1-hour increments. A solid, vertical line (with the local time at the top) indicates the tide height corresponding to the time shown in the local time box. Max. level High tide curve Low tide curve Current time bar Current tide height bar MLLW Min. level Station time Night Day The Tide curve is shown as a shaded area, where higher tides are taller (blue) and lower tides are shorter (red). The solid, horizontal line indicates the tide height. The figure to the left of the line shows the present tide level. The Mean Lower Low Water (MLLW) appears as a solid, horizontal line near the bottom of the chart (this line appears only if the tide height range is zero or below). GPSMAP 292/298 Owner's Manual
-
 1
1 -
2
-
3
-
4
-
5
-
6
-
7
-
8
-
9
-
10
-
11
-
12
-
13
-
14
-
15
-
16
-
17
-
18
-
19
-
20
-
21
-
22
-
23
-
24
-
25
-
26
-
27
-
28
-
29
-
30
-
31
-
32
-
33
-
34
-
35
-
36
-
37
-
38
-
39
-
40
-
 41
41 -
 42
42 -
 43
43 -
 44
44 -
 45
45 -
 46
46 -
 47
47 -
 48
48 -
 49
49 -
 50
50 -
 51
51 -
52
-
53
-
54
-
55
-
56
-
57
-
58
-
59
-
60
-
61
-
62
-
63
-
64
-
65
-
66
-
67
-
68
-
69
-
70
-
71
-
72
-
73
-
74
-
75
-
76
-
77
-
78
-
79
-
80
-
81
-
82
-
83
-
84
-
85
-
86
-
87
-
88
-
89
-
90
-
91
-
92
-
93
-
94
-
95
-
96
-
97
-
98
-
99
-
100
-
101
-
102
-
103
-
104
-
105
-
106
-
107
-
108
-
109
-
110
-
111
-
112
-
113
-
114
-
115
-
116
-
117
-
118
-
119
-
120
 |
 |