HP 800 ACSE/Presentation and ROSE Interface Programmer's Guide - Page 72
Trace Output
 |
View all HP 800 manuals
Add to My Manuals
Save this manual to your list of manuals |
Page 72 highlights
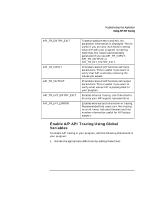
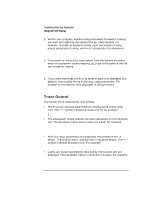
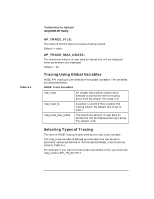
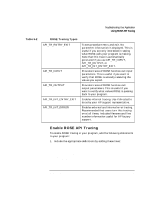
Troubleshooting Your Application Using A/P API Tracing 2. Within your program, enable tracing and select the level of tracing you want by modifying the value of the ap_trace variable. For example, to enable procedure tracing, input parameters tracing, output parameters tracing, and error tracing enter the statement: ap_trace = API_TR_ENTRY_EXIT | API_TR_INPUT | API_TR_OUTPUT|API_TR_INT_ERROR; 3. If you want to redirect the trace output from the default file stderr enter the statement: where /tmp/my_ap_trace is the name of the file you choose for tracing. if ((ap_trace_fp = fopen("/tmp/my_ap_trace", "w")) == NULL) ap_trace_fp = stderr; 4. If you want more than the first 16 bytes of data to be displayed (the default), then modify the ap_trace_max_udata parameter. For example to increase the data displayed to 256 bytes enter: p_trace_max_udata = 256; Trace Output The format of the trace output is as follows: • The first line indicates what function is being called and at what time. The "->" symbol indicates procedure entry for example: 15:53:38 -> ap_open() • The subsequent line(s) indicate the input parameters to the function call. The parameter name and its value are listed. For example: 14:53:39 -> ap_set_env() fd = 3. attr = AP_ROLE_ALLOWED *val = 1 • After the input parameters are displayed, the procedure exit is shown. The time of return, and the return value are shown. The "
-
 1
1 -
2
-
3
-
4
-
5
-
6
-
7
-
8
-
9
-
10
-
11
-
12
-
13
-
14
-
15
-
16
-
17
-
18
-
19
-
20
-
21
-
22
-
23
-
24
-
25
-
26
-
27
-
28
-
29
-
30
-
31
-
32
-
33
-
34
-
35
-
36
-
37
-
38
-
39
-
40
-
41
-
42
-
43
-
44
-
45
-
46
-
47
-
48
-
49
-
50
-
51
-
52
-
53
-
54
-
55
-
56
-
57
-
58
-
59
-
60
-
61
-
62
-
63
-
64
-
65
-
66
-
 67
67 -
 68
68 -
 69
69 -
 70
70 -
 71
71 -
 72
72 -
 73
73 -
 74
74 -
 75
75 -
 76
76 -
 77
77 -
78
-
79
-
80
-
81
-
82
-
83
-
84
-
85
-
86
-
87
-
88
-
89
-
90
-
91
-
92
-
93
-
94
-
95
-
96
-
97
-
98
-
99
-
100
-
101
-
102
-
103
-
104
-
105
-
106
-
107
-
108
-
109
 |
 |