HP 800 ACSE/Presentation and ROSE Interface Programmer's Guide - Page 73
Tracing in Multi-threaded Applications
 |
View all HP 800 manuals
Add to My Manuals
Save this manual to your list of manuals |
Page 73 highlights
Troubleshooting Your Application Using A/P API Tracing 15:53:38 len = 4 val->buf = (4/4) 52 01 00 04 R.... • The amount of data displayed is based on the value set for ap_trace_max_udata. For example, if ap_trace_max_udata is set to 16, only the first 16 bytes are displayed as shown below: val->sad.buf = (16/22) 06 69 5F 73 73 65 6C 06 69 5F 74 73 65 6C 07 48.i_ssel.i_tsel.H The item "(16/22)" indicates that 16 of the 22 bytes of data output is displayed. The following line contains the actual data in both hexadecimal and ASCII representation. Note that for some of the A/P calls such as ap_snd(), ap_rcv() and ap_poll() the notation ">" is used to indicate input parameters and "
-
 1
1 -
2
-
3
-
4
-
5
-
6
-
7
-
8
-
9
-
10
-
11
-
12
-
13
-
14
-
15
-
16
-
17
-
18
-
19
-
20
-
21
-
22
-
23
-
24
-
25
-
26
-
27
-
28
-
29
-
30
-
31
-
32
-
33
-
34
-
35
-
36
-
37
-
38
-
39
-
40
-
41
-
42
-
43
-
44
-
45
-
46
-
47
-
48
-
49
-
50
-
51
-
52
-
53
-
54
-
55
-
56
-
57
-
58
-
59
-
60
-
61
-
62
-
63
-
64
-
65
-
66
-
67
-
 68
68 -
 69
69 -
 70
70 -
 71
71 -
 72
72 -
 73
73 -
 74
74 -
 75
75 -
 76
76 -
 77
77 -
 78
78 -
79
-
80
-
81
-
82
-
83
-
84
-
85
-
86
-
87
-
88
-
89
-
90
-
91
-
92
-
93
-
94
-
95
-
96
-
97
-
98
-
99
-
100
-
101
-
102
-
103
-
104
-
105
-
106
-
107
-
108
-
109
 |
 |

Chapter 5
73
Troubleshooting Your Application
Using A/P API Tracing
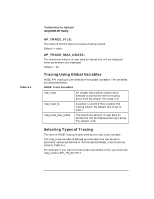
15:53:38 <- ap_set_env() = 0
attr = AP_CNTX_NAME
val->len = 4
val->buf = (4/4)
52 01 00 04 R
....
•
The amount of data displayed is based on the value set for
ap_trace_max_udata. For example, if ap_trace_max_udata is set to
16, only the first 16 bytes are displayed as shown below:
val->sad.buf = (16/22)
06 69 5F 73 73 65 6C 06 69 5F 74 73 65 6C 07
48.i_ssel.i_tsel.H
The item “(16/22)” indicates that 16 of the 22 bytes of data output is
displayed. The following line contains the actual data in both
hexadecimal and ASCII representation.
Note that for some of the A/P calls such as ap_snd(), ap_rcv() and
ap_poll() the notation “>” is used to indicate input parameters and “<“
indicates output parameters. For example:
14:53:40 -> ap_poll()
> nfds = 1
> timeout = -1
> fds = Ox68FAC6A8
> fds[0].fd = 3
> fds[0].events = Ox4
< fds[0].revents = Ox4
14:53:40 <- ap_poll() = 1
Tracing in Multi-threaded Applications
A/P API traces in multi-threaded applications include thread-ids of the
executing threads as part of the trace output.
This identifies a particular
part of the trace output as belonging to a particular thread. The format
of the trace output for multi-threaded applications is as follows:
>>> thread-id
= 5 >>>
Wed Mar
5 15:26:30 1997 -> ap_open()
<<< thread-id
= 5 <<<
>>> thread-id
= 6 >>>
Wed Mar
5 15:26:30 1997 -> ap_open()
<<< thread-id
= 6 <<<
>>> thread-id
= 7 >>>
Wed Mar
5 15:26:30 1997 -> ap_open()
<<< thread-id
= 7 <<<
>>> thread-id
= 5 >>>
>
pathname = /dev/osipi
>
oflags = 0x0
<<< thread-id
= 5 <<<