HP 800 ACSE/Presentation and ROSE Interface Programmer's Guide - Page 78
The subsequent lines indicate the input parameters to the function
 |
View all HP 800 manuals
Add to My Manuals
Save this manual to your list of manuals |
Page 78 highlights
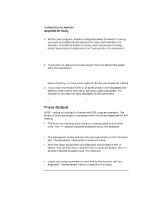
Troubleshooting Your Application Using ROSE API Tracing 2. Within your program, enable tracing and select the level of tracing you want by modifying the value of the rose_trace variable. For example, to enable procedure tracing, input parameters tracing, output parameters tracing and error tracing, enter the statement: rose_trace = API_TR_ENTRY_EXIT|API_TR_INPUT|API_TR_OUTPUT|API_TR_I NT_ERROR; 3. If you want to redirect the trace output from the default file stderr enter the statement: if ((rose_trace_fp=fopen("/tmp/my_ro_trace", "w")) == NULL); rose_trace_fp = stderr; where /tmp/my_ro_trace is the name of the file you choose for tracing. 4. If you want more than the first 16 bytes of data to be displayed (the default), then modify the rose_trace_max_udata parameter. For example to increase the data displayed to 256 bytes enter: rose_trace_max_udata = 256; Trace Output ROSE tracing is included in the online ROSE program example. The format of the trace output is consistent with the format described for A/P tracing: • The first line indicates what function is being called and at what time. The "->" symbol indicates procedure entry. For example: 12:54:30 -> ro_bind() • The subsequent line(s) indicate the input parameters to the function call. The parameter name and its value are listed. • After the input parameters are displayed, the procedure exit is shown. The time of return, and the return value are shown. The "
-
 1
1 -
2
-
3
-
4
-
5
-
6
-
7
-
8
-
9
-
10
-
11
-
12
-
13
-
14
-
15
-
16
-
17
-
18
-
19
-
20
-
21
-
22
-
23
-
24
-
25
-
26
-
27
-
28
-
29
-
30
-
31
-
32
-
33
-
34
-
35
-
36
-
37
-
38
-
39
-
40
-
41
-
42
-
43
-
44
-
45
-
46
-
47
-
48
-
49
-
50
-
51
-
52
-
53
-
54
-
55
-
56
-
57
-
58
-
59
-
60
-
61
-
62
-
63
-
64
-
65
-
66
-
67
-
68
-
69
-
70
-
71
-
72
-
 73
73 -
 74
74 -
 75
75 -
 76
76 -
 77
77 -
 78
78 -
 79
79 -
 80
80 -
 81
81 -
 82
82 -
 83
83 -
84
-
85
-
86
-
87
-
88
-
89
-
90
-
91
-
92
-
93
-
94
-
95
-
96
-
97
-
98
-
99
-
100
-
101
-
102
-
103
-
104
-
105
-
106
-
107
-
108
-
109
 |
 |