HP HP48G hp 49g_user's manual_English_E_F1633-90001.pdf - Page 235

Two-Proportion Z-Interval, Two-Sample T-test

Page 235 highlights

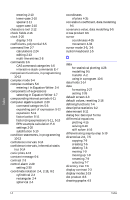
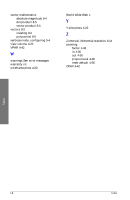
slopefield plots 4-19 solving equations 6-2 interpreting results 6-4 linear systems 6-7, 8-11 simultaneous equations 6-7 special characters 2-11 stack Also see history example calculations E-4 interactive stack commands E-7 manipulating data E-7 performing calculations E-3 standard deviation 9-3 standard mode 2-9 statistical plots 4-3, 4-5, 4-28 statistics application 9-2 descriptive 9-2 inferential 9-7 mean 9-3 regression tests 9-6 single variable 9-3 standard deviation 9-3 summary 9-2 variance 9-3 status 2-4 status area 2-3 change size of 2-19 changing the size of 2-20 step-by-step differentiating 5-19 step-by-step mode 5-4 stiff solver 4-16, 6-10 substitution 5-10 summary statistics 9-6 symbolic solving 5-6 symbols, entering 1-4, 2-11 syntax 1-5 system halt D-4 T tables 4-40 customizing 4-40 term selection mode 3-5 terms selecting in Equation Writer 3-7 terms and conditions xi textbook mode 2-20 Index 3-D plots 4-27 time formatting 2-27 setting 2-26 time-value-of-money calculations 6-11 TPAR 4-42 tracing a plot 4-35 transferring data A-2 trapping errors 10-15 tree structure in Equation Writer 3-7 trigonometric expressions 5-14 trigonometry 5-14 accessing commands 5-6 troubleshooting xi, D-1 truth plots 4-17 turning on and off 2-2 Two-Proportion Z-Interval 9-16 Two-Proportion Z-Test 9-11 Two-Sample T-Interval 9-17 Two-Sample T-test 9-13 Two-Sample Z-Interval 9-15 U units C-1 converting C-1 SI C-1 upper-case characters 2-10 user keyboard 1-5, 2-4 user-defined functions 7-4 V variables 2-6, 7-2 copying 7-9 creating 7-2 deleting 7-8 editing 7-10 global 10-8 independent 5-4 listing 7-3 local 10-8 moving 7-9 plotting 4-41 renaming 7-9 selecting 7-7 variance 9-3 I-7 Index

  • 1
  • 2
  • 3
  • 4
  • 5
  • 6
  • 7
  • 8
  • 9
  • 10
  • 11
  • 12
  • 13
  • 14
  • 15
  • 16
  • 17
  • 18
  • 19
  • 20
  • 21
  • 22
  • 23
  • 24
  • 25
  • 26
  • 27
  • 28
  • 29
  • 30
  • 31
  • 32
  • 33
  • 34
  • 35
  • 36
  • 37
  • 38
  • 39
  • 40
  • 41
  • 42
  • 43
  • 44
  • 45
  • 46
  • 47
  • 48
  • 49
  • 50
  • 51
  • 52
  • 53
  • 54
  • 55
  • 56
  • 57
  • 58
  • 59
  • 60
  • 61
  • 62
  • 63
  • 64
  • 65
  • 66
  • 67
  • 68
  • 69
  • 70
  • 71
  • 72
  • 73
  • 74
  • 75
  • 76
  • 77
  • 78
  • 79
  • 80
  • 81
  • 82
  • 83
  • 84
  • 85
  • 86
  • 87
  • 88
  • 89
  • 90
  • 91
  • 92
  • 93
  • 94
  • 95
  • 96
  • 97
  • 98
  • 99
  • 100
  • 101
  • 102
  • 103
  • 104
  • 105
  • 106
  • 107
  • 108
  • 109
  • 110
  • 111
  • 112
  • 113
  • 114
  • 115
  • 116
  • 117
  • 118
  • 119
  • 120
  • 121
  • 122
  • 123
  • 124
  • 125
  • 126
  • 127
  • 128
  • 129
  • 130
  • 131
  • 132
  • 133
  • 134
  • 135
  • 136
  • 137
  • 138
  • 139
  • 140
  • 141
  • 142
  • 143
  • 144
  • 145
  • 146
  • 147
  • 148
  • 149
  • 150
  • 151
  • 152
  • 153
  • 154
  • 155
  • 156
  • 157
  • 158
  • 159
  • 160
  • 161
  • 162
  • 163
  • 164
  • 165
  • 166
  • 167
  • 168
  • 169
  • 170
  • 171
  • 172
  • 173
  • 174
  • 175
  • 176
  • 177
  • 178
  • 179
  • 180
  • 181
  • 182
  • 183
  • 184
  • 185
  • 186
  • 187
  • 188
  • 189
  • 190
  • 191
  • 192
  • 193
  • 194
  • 195
  • 196
  • 197
  • 198
  • 199
  • 200
  • 201
  • 202
  • 203
  • 204
  • 205
  • 206
  • 207
  • 208
  • 209
  • 210
  • 211
  • 212
  • 213
  • 214
  • 215
  • 216
  • 217
  • 218
  • 219
  • 220
  • 221
  • 222
  • 223
  • 224
  • 225
  • 226
  • 227
  • 228
  • 229
  • 230
  • 231
  • 232
  • 233
  • 234
  • 235
  • 236

Index
I-7
Index
slopefield plots
4-19
solving equations
6-2
interpreting results
6-4
linear systems
6-7
,
8-11
simultaneous equations
6-7
special characters
2-11
stack
Also see
history
example calculations
E-4
interactive stack commands
E-7
manipulating data
E-7
performing calculations
E-3
standard deviation
9-3
standard mode
2-9
statistical plots
4-3
,
4-5
,
4-28
statistics
application
9-2
descriptive
9-2
inferential
9-7
mean
9-3
regression tests
9-6
single variable
9-3
standard deviation
9-3
summary
9-2
variance
9-3
status
2-4
status area
2-3
change size of
2-19
changing the size of
2-20
step-by-step differentiating
5-19
step-by-step mode
5-4
stiff solver
4-16
,
6-10
substitution
5-10
summary statistics
9-6
symbolic solving
5-6
symbols, entering
1-4
,
2-11
syntax
1-5
system halt
D-4
T
tables
4-40
customizing
4-40
term selection mode
3-5
terms
selecting in Equation Writer
3-7
terms and conditions
xi
textbook mode
2-20
3-D plots
4-27
time
formatting
2-27
setting
2-26
time-value-of-money calculations
6-11
TPAR
4-42
tracing a plot
4-35
transferring data
A-2
trapping errors
10-15
tree structure
in Equation Writer
3-7
trigonometric expressions
5-14
trigonometry
5-14
accessing commands
5-6
troubleshooting
xi
,
D-1
truth plots
4-17
turning on and off
2-2
Two-Proportion Z-Interval
9-16
Two-Proportion Z-Test
9-11
Two-Sample T-Interval
9-17
Two-Sample T-test
9-13
Two-Sample Z-Interval
9-15
U
units
C-1
converting
C-1
SI
C-1
upper-case characters
2-10
user keyboard
1-5
,
2-4
user-defined functions
7-4
V
variables
2-6
,
7-2
copying
7-9
creating
7-2
deleting
7-8
editing
7-10
global
10-8
independent
5-4
listing
7-3
local
10-8
moving
7-9
plotting
4-41
renaming
7-9
selecting
7-7
variance
9-3