HP ML570 Novell NetWare 6 performance tuning guidelines for ProLiant servers - Page 27
category, description, Use this to schedule any valid console
 |
UPC - 808736750752
View all HP ML570 manuals
Add to My Manuals
Save this manual to your list of manuals |
Page 27 highlights
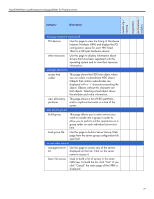
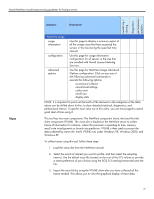
monitoring / viewing diagnostics performance / statistics Novell NetWare 6 performance tuning guidelines for ProLiant servers category description diagnose server (continued) reports / log files Allows you to view a Server Configuration √ Report immediately and send the report via email. The report contains the following files: All - .ncf, .bat, .cfg, abend.log files and more. manage server volumes Displays a pie chart of free/used information √ on a specific volume. It also allows you to view specific volume info such as whether it is mounted, file system name, and several other volume attributes. console screens Lists all the options that can be used to √ access the server console screens. connections Use this page as a connection manager to √ view connection info, clear connections that are not logged on and broadcast message to everyone logged on the server. set parameters Use this page to: √ - view and modify set parameter values - view hidden set parameter values (Yes/No) schedule tasks Use this page to schedule any valid console √ commands (such as to run .ncf file, load nlm, send messages, etc.) you want executed on the server. console commands Use this page to view a list of commands that can be executed on the server console. view memory Use this page to view the following system √ config memory information: • total system memory • original cache memory • current cache memory • file system memory • reserved swap memory • swap file size • virtual memory pages • etc. √ √ √ √ 27
-
 1
1 -
2
-
3
-
4
-
5
-
6
-
7
-
8
-
9
-
10
-
11
-
12
-
13
-
14
-
15
-
16
-
17
-
18
-
19
-
20
-
21
-
 22
22 -
 23
23 -
 24
24 -
 25
25 -
 26
26 -
 27
27 -
 28
28 -
 29
29 -
 30
30 -
 31
31 -
 32
32 -
33
-
34
-
35
-
36
-
37
-
38
-
39
-
40
-
41
-
42
-
43
-
44
-
45
-
46
-
47
-
48
-
49
-
50
-
51
 |
 |
