HP ML570 Novell NetWare 6 performance tuning guidelines for ProLiant servers - Page 30
Vtune, introducing NetBench, Windows XP.
 |
UPC - 808736750752
View all HP ML570 manuals
Add to My Manuals
Save this manual to your list of manuals |
Page 30 highlights
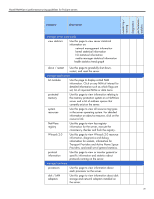
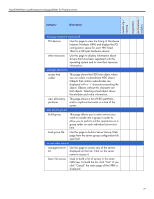
Novell NetWare 6 performance tuning guidelines for ProLiant servers monitoring / viewing diagnostics performance / statistics Vtune category description NetWare usage usage Use this page to display a summary report of √ √ information all the unique users that have accessed the servers in the tree during the specified time interval. configuration Use this page for usage information √ configuration for all servers in the tree that are enrolled with Novell License Metering Services. advanced options Use this page for NetWare Usage Advanced √ Options configuration. Click on any one of the following advanced commands to execute the following options: • recommend collector • cancel local settings • collect now • enroll now • display stats NOTE: It is important to point out that each of the elements in the categories of the table above can be drilled down further, to show detailed statistical, diagnostics, and performance metrics. To get the most value out of this utility, you are encouraged to spend good deal of time using it. This tool has two main components. The NetWare component (vtune.nlm) and the Intel client component (VTUNE). The vtune.nlm is loaded on the NetWare server to collect traces of information for instance, where the processor is spending its time, memory read/write misalignments or branch mis-prediction. VTUNE is then used to process the data collected by vtune.nlm. Intel's VTUNE runs under Windows 9X, Windows 2000, and Windows XP. To collect traces using this tool, follow these steps: 1. Load the vtune.nlm from the NetWare console. 2. Select the events of interest you want to profile, and then select the sampling interval. Use the default trace file located on the root of the SYS volume or provide a name preference of your choice using the DOS 8.3 naming format and save the file. 3. Import the trace file by using the VTUNE client after you have collected all the traces needed. This allows you to view the graphical display of trace data. 30
-
 1
1 -
2
-
3
-
4
-
5
-
6
-
7
-
8
-
9
-
10
-
11
-
12
-
13
-
14
-
15
-
16
-
17
-
18
-
19
-
20
-
21
-
22
-
23
-
24
-
 25
25 -
 26
26 -
 27
27 -
 28
28 -
 29
29 -
 30
30 -
 31
31 -
 32
32 -
 33
33 -
 34
34 -
 35
35 -
36
-
37
-
38
-
39
-
40
-
41
-
42
-
43
-
44
-
45
-
46
-
47
-
48
-
49
-
50
-
51
 |
 |