Netgear WMS5316-Wireless Reference Manual - Page 42
Network Usage Statistics, Network Topology, Summary > Advanced > Network Usage, Refresh
 |
View all Netgear WMS5316-Wireless manuals
Add to My Manuals
Save this manual to your list of manuals |
Page 42 highlights
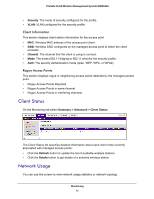
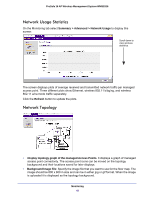
ProSafe 16 AP Wireless Management System WMS5316 Network Usage Statistics On the Monitoring tab select Summary > Advanced > Network Usage to display this screen: Scroll down to view wireless statistics. The screen displays plots of average received and transmitted network traffic per managed access point. Three different plots show Ethernet, wireless 802.11 b/bg/ng, and wireless 802.11 a/na mode traffic separately. Click the Refresh button to update the plots. Network Topology • Display topology graph of the managed Access Points. It displays a graph of managed access point connectivity. The access point icons can be moved on the topology background and their locations saved for later displays. • Background Image File: Specify the image file that you want to use for the floor map. The image should be 800 x 600 in size and can be in either jpg or gif format. When the image is uploaded it is displayed as the topology background. Monitoring 42
-
 1
1 -
2
-
3
-
4
-
5
-
6
-
7
-
8
-
9
-
10
-
11
-
12
-
13
-
14
-
15
-
16
-
17
-
18
-
19
-
20
-
21
-
22
-
23
-
24
-
25
-
26
-
27
-
28
-
29
-
30
-
31
-
32
-
33
-
34
-
35
-
36
-
 37
37 -
 38
38 -
 39
39 -
 40
40 -
 41
41 -
 42
42 -
 43
43 -
 44
44 -
 45
45 -
 46
46 -
 47
47 -
48
-
49
-
50
-
51
-
52
-
53
-
54
-
55
-
56
-
57
-
58
-
59
-
60
-
61
-
62
-
63
-
64
-
65
-
66
-
67
-
68
-
69
-
70
 |
 |
