Canon CanoScan D2400UF CanoScan D1230U/D2400U Plug-in Module CS-U 4.1 for Mac - Page 46
The Relationship Between the Tone Curve, and Image Brightness, Gamma Value = 1
 |
View all Canon CanoScan D2400UF manuals
Add to My Manuals
Save this manual to your list of manuals |
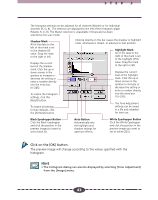
Page 46 highlights
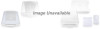
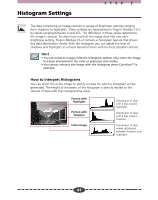
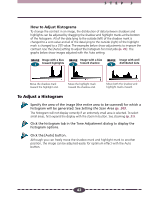
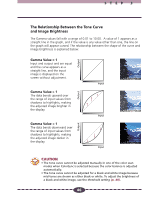
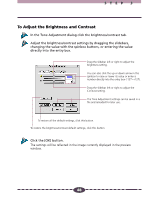
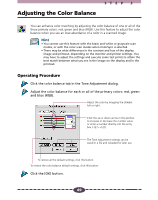
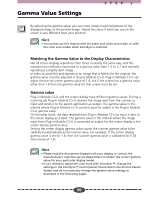
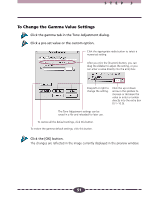
STEP 3 The Relationship Between the Tone Curve and Image Brightness The Gamma values fall with a range of 0.01 to 10.00. A value of 1 appears as a straight line in the graph, and if the value is any value other than one, the line on the graph will appear curved. The relationship between the shape of the curve and image brightness is explained below. Gamma Value = 1 Input and output and are equal and the curve appears as a straight line, and the input image is displayed on the screen without adjustment. Gamma Value > 1 The data bends upward over the range of input values from shadows to highlights, making the adjusted image brighter in the display. Gamma Value < 1 The data bends downward over the range of input values from shadows to highlights, making the adjusted image darker in the display. Output Output Output ➟ Input ➟ Input ➟ Input CAUTION • The tone curve cannot be adjusted manually in one of the color scan modes when ColorSync is selected because the color balance is adjusted automatically. • The tone curve cannot be adjusted for a black and white image because mid-tones are shown as either black or white. To adjust the brightness of a black and white image, use the threshold setting (p. 48). 46
-
 1
1 -
2
-
3
-
4
-
5
-
6
-
7
-
8
-
9
-
10
-
11
-
12
-
13
-
14
-
15
-
16
-
17
-
18
-
19
-
20
-
21
-
22
-
23
-
24
-
25
-
26
-
27
-
28
-
29
-
30
-
31
-
32
-
33
-
34
-
35
-
36
-
37
-
38
-
39
-
40
-
 41
41 -
 42
42 -
 43
43 -
 44
44 -
 45
45 -
 46
46 -
 47
47 -
 48
48 -
 49
49 -
 50
50 -
 51
51 -
52
-
53
-
54
-
55
-
56
-
57
-
58
-
59
-
60
-
61
-
62
-
63
-
64
-
65
-
66
-
67
-
68
-
69
-
70
-
71
-
72
-
73
 |
 |