Dell PowerVault 50F Dell PowerVault Switch Manager User's Guide - Page 31
Performance, perform., Switch Management Application, Loss of Sync, Loss of Signal
 |
View all Dell PowerVault 50F manuals
Add to My Manuals
Save this manual to your list of manuals |
Page 31 highlights
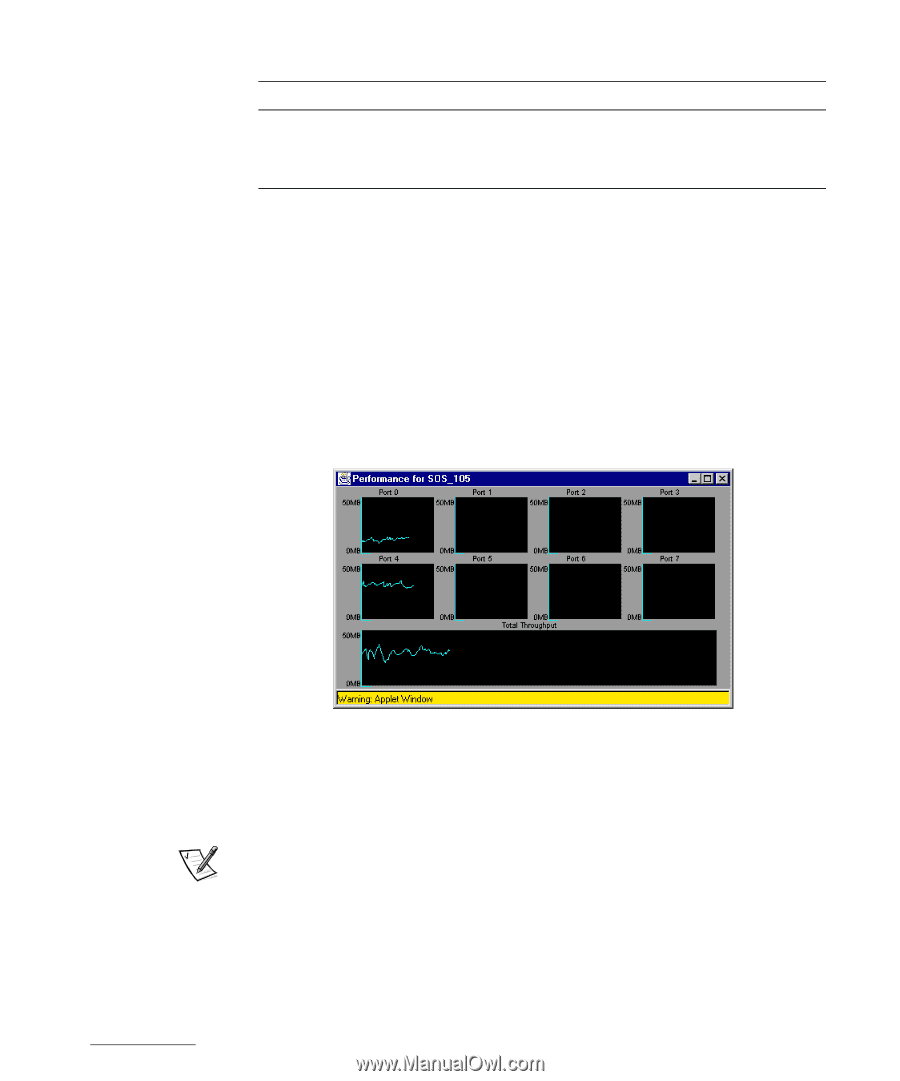
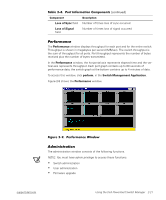
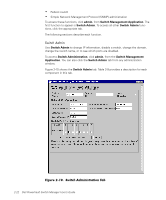
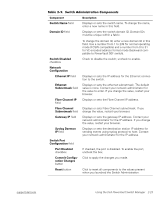
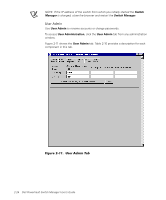
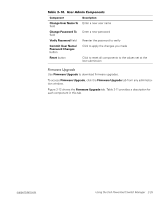
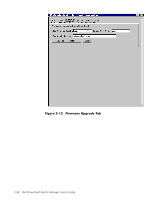
Loss of Sync field Loss of Signal field Number of times loss of sync occurred Number of times loss of signal occurred The Performance window displays throughput for each port and for the entire switch. Throughput is shown in megabytes per second (MB/sec). The switch throughput is the sum of throughput for all ports. Port throughput represents the number of bytes received plus the number of bytes transmitted. In the Performance window, the horizontal axis represents elapsed time and the vertical axis represents throughput. Each port graph contains up to 60 seconds of performance data; the switch graph at the bottom contains up to 4 minutes of data. To access this window, click perform. in the Switch Management Application. Figure 2-9 shows the Performance window. The administration window consists of the following functions. NOTE: You must have admin privilege to access these functions. Switch administration User administration Firmware upgrade support.dell.com Using the Dell PowerVault Switch Manager 2-21
-
 1
1 -
2
-
3
-
4
-
5
-
6
-
7
-
8
-
9
-
10
-
11
-
12
-
13
-
14
-
15
-
16
-
17
-
18
-
19
-
20
-
21
-
22
-
23
-
24
-
25
-
 26
26 -
 27
27 -
 28
28 -
 29
29 -
 30
30 -
 31
31 -
 32
32 -
 33
33 -
 34
34 -
 35
35 -
 36
36 -
37
-
38
-
39
-
40
-
41
-
42
 |
 |