Epson RX-80 User Manual - Page 70
results for the first line are shown in The pin values are
 |
View all Epson RX-80 manuals
Add to My Manuals
Save this manual to your list of manuals |
Page 70 highlights
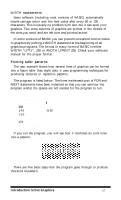
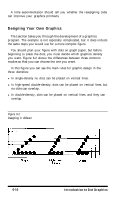
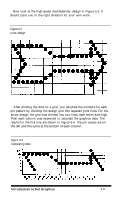
Now look at the high-speed doubledensity design in Figure 6-3. It should point you in the right direction for your own work. Figure 6-3. Arrow design After plotting the dots on a grid, you calculate the numbers for each pin pattern by dividing the design grid into separate print lines. For the arrow design, the grid was divided into two lines, each seven dots high. Then each column was examined to calculate the graphics data. The results for the first line are shown in Figure 6-4. The pin values are on the left and the sums at the bottom of each column. Figure 6-4. Calculating data Introduction to Dot Graphics 6.11
-
 1
1 -
2
-
3
-
4
-
5
-
6
-
7
-
8
-
9
-
10
-
11
-
12
-
13
-
14
-
15
-
16
-
17
-
18
-
19
-
20
-
21
-
22
-
23
-
24
-
25
-
26
-
27
-
28
-
29
-
30
-
31
-
32
-
33
-
34
-
35
-
36
-
37
-
38
-
39
-
40
-
41
-
42
-
43
-
44
-
45
-
46
-
47
-
48
-
49
-
50
-
51
-
52
-
53
-
54
-
55
-
56
-
57
-
58
-
59
-
60
-
61
-
62
-
63
-
64
-
 65
65 -
 66
66 -
 67
67 -
 68
68 -
 69
69 -
 70
70 -
 71
71 -
 72
72 -
 73
73 -
 74
74 -
 75
75 -
76
-
77
-
78
-
79
-
80
-
81
-
82
-
83
-
84
-
85
-
86
-
87
-
88
-
89
-
90
-
91
-
92
-
93
-
94
-
95
-
96
-
97
-
98
-
99
-
100
-
101
-
102
-
103
-
104
-
105
-
106
-
107
-
108
-
109
-
110
-
111
-
112
-
113
-
114
-
115
-
116
-
117
-
118
-
119
-
120
-
121
-
122
-
123
-
124
-
125
-
126
-
127
-
128
-
129
-
130
-
131
-
132
-
133
-
134
-
135
-
136
-
137
-
138
-
139
-
140
-
141
-
142
-
143
-
144
-
145
-
146
-
147
-
148
-
149
 |
 |
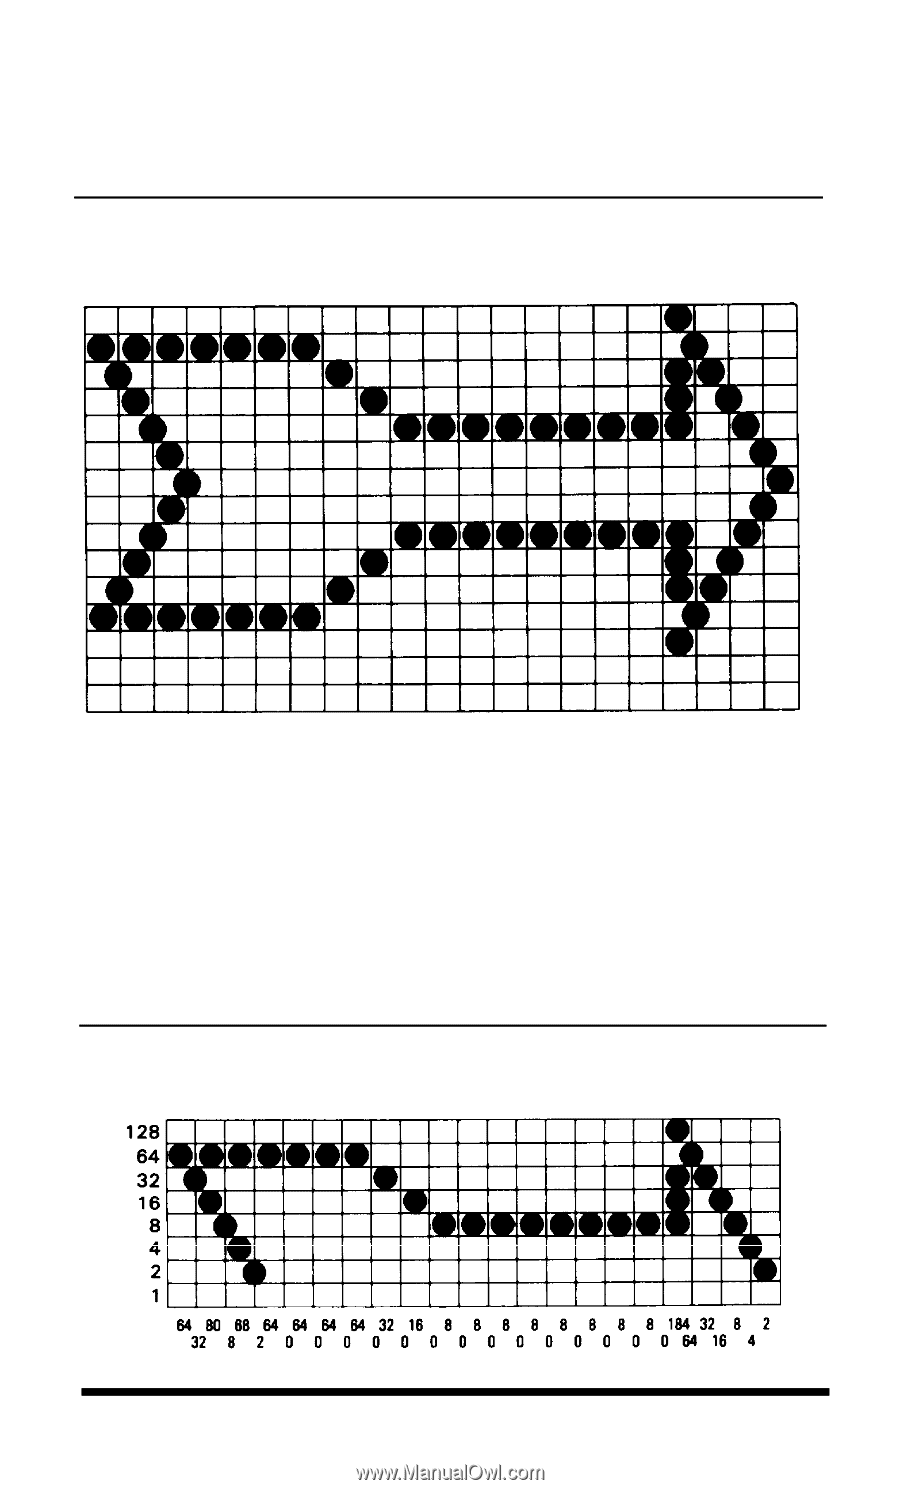
Now look at the high-speed doubledensity design in Figure 6-3. It
should point you in the right direction for your own work.
Figure
6-3.
Arrow
design
After plotting the dots on a grid, you calculate the numbers for each
pin pattern by dividing the design grid into separate print lines. For the
arrow design, the grid was divided into two lines, each seven dots high.
Then each column was examined to calculate the graphics data. The
results for the first line are shown in Figure 6-4. The pin values are on
the left and the sums at the bottom of each column.
Figure 6-4.
Calculating data
Introduction to Dot Graphics
6.11