HP Brocade 8/24c Brocade Web Tools Administrator's Guide v6.1.0 (53-1000606-02 - Page 116
Monitoring performance using Web Tools, For the Brocade 200E
 |
View all HP Brocade 8/24c manuals
Add to My Manuals
Save this manual to your list of manuals |
Page 116 highlights
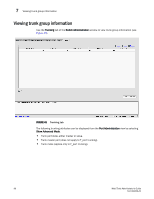
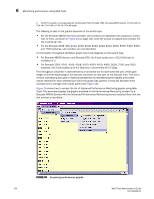
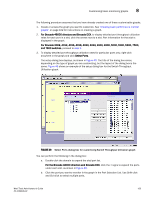
8 Monitoring performance using Web Tools 2. ALPA Error graph is not supported on the Brocade 7500, Brocade 7600, Brocade 48000 director, or DCX with an FC4-18i, FC4-16IP, or FC4-18, FC4-48 blade. The labeling of axes in the graphs depends on the switch type. • For the Brocade 48000 directors and DCX, slot numbers are displayed with expansion arrows next to them, as shown in Figure 46 on page 100. Click the arrows to expand and contract the list of ports per slot. • For the Brocade 200E, 300, 4012, 4016, 4018, 4020, 4024, 4100, 4900, 5000, 5100, 5300, and 7500 switches, slot numbers are not identified. For the Switch Throughput Utilization graph, the X-axis depends on the switch type. • For Brocade 48000 director and Brocade DCX, the X-axis scales up to 102.4 Gbit/sec in multiples of 2. • For Brocade 200E, 4012, 4016, 4018, 4020, 4024, 4100, 4900, 5000, 7500, and 7600 switches, the X-axis scales up to 4.0 Gbit/sec in increments of 0.4 Gbps. Port throughput utilization is represented by a horizontal bar for each selected port, which gets longer or shorter depending on the percent utilization for that port at the last poll time. Thin short vertical intersecting bars give a historical perspective by representing the highest and lowest values reached for each selected port since the graph was opened. A third bar between them represents the average of all values polled (see Figure 46). Figure 46 shows how to access the list of Advanced Performance Monitoring graphs using Web Tools. This example displays the graphs available in the Performance Monitoring window for a Brocade 48000 director with the Advanced Performance Monitoring license installed. Note that the slot number is identified. FIGURE 46 Accessing performance graphs 100 Web Tools Administrator's Guide 53-1000606-02
-
 1
1 -
2
-
3
-
4
-
5
-
6
-
7
-
8
-
9
-
10
-
11
-
12
-
13
-
14
-
15
-
16
-
17
-
18
-
19
-
20
-
21
-
22
-
23
-
24
-
25
-
26
-
27
-
28
-
29
-
30
-
31
-
32
-
33
-
34
-
35
-
36
-
37
-
38
-
39
-
40
-
41
-
42
-
43
-
44
-
45
-
46
-
47
-
48
-
49
-
50
-
51
-
52
-
53
-
54
-
55
-
56
-
57
-
58
-
59
-
60
-
61
-
62
-
63
-
64
-
65
-
66
-
67
-
68
-
69
-
70
-
71
-
72
-
73
-
74
-
75
-
76
-
77
-
78
-
79
-
80
-
81
-
82
-
83
-
84
-
85
-
86
-
87
-
88
-
89
-
90
-
91
-
92
-
93
-
94
-
95
-
96
-
97
-
98
-
99
-
100
-
101
-
102
-
103
-
104
-
105
-
106
-
107
-
108
-
109
-
110
-
 111
111 -
 112
112 -
 113
113 -
 114
114 -
 115
115 -
 116
116 -
 117
117 -
 118
118 -
 119
119 -
 120
120 -
 121
121 -
122
-
123
-
124
-
125
-
126
-
127
-
128
-
129
-
130
-
131
-
132
-
133
-
134
-
135
-
136
-
137
-
138
-
139
-
140
-
141
-
142
-
143
-
144
-
145
-
146
-
147
-
148
-
149
-
150
-
151
-
152
-
153
-
154
-
155
-
156
-
157
-
158
-
159
-
160
-
161
-
162
-
163
-
164
-
165
-
166
-
167
-
168
-
169
-
170
-
171
-
172
-
173
-
174
-
175
-
176
-
177
-
178
-
179
-
180
-
181
-
182
-
183
-
184
-
185
-
186
-
187
-
188
-
189
-
190
-
191
-
192
-
193
-
194
-
195
-
196
-
197
-
198
-
199
-
200
-
201
-
202
-
203
-
204
-
205
-
206
-
207
-
208
-
209
-
210
-
211
-
212
-
213
-
214
-
215
-
216
-
217
-
218
-
219
-
220
-
221
-
222
-
223
-
224
-
225
-
226
-
227
-
228
-
229
-
230
-
231
-
232
-
233
-
234
-
235
-
236
-
237
-
238
-
239
-
240
-
241
-
242
-
243
-
244
-
245
-
246
-
247
-
248
-
249
-
250
-
251
-
252
-
253
-
254
-
255
-
256
-
257
-
258
-
259
-
260
-
261
-
262
-
263
-
264
-
265
 |
 |