HP Brocade 8/24c Brocade Web Tools Administrator's Guide v6.1.0 (53-1000606-02 - Page 67
Displaying Switch Events, Fabric Tree, Filtering Fabric and Switch Events, Switch View
 |
View all HP Brocade 8/24c manuals
Add to My Manuals
Save this manual to your list of manuals |
Page 67 highlights
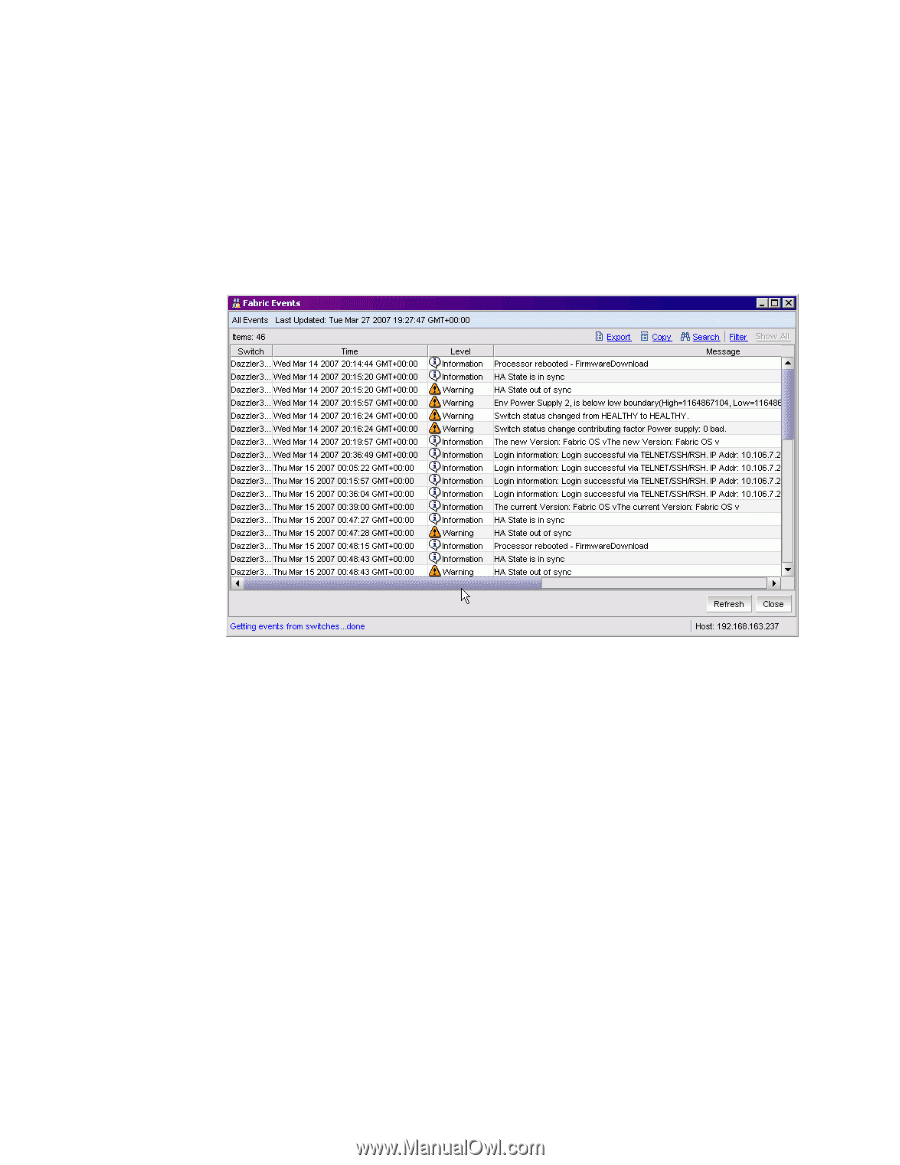
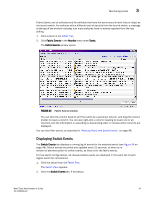
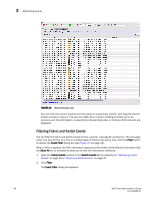
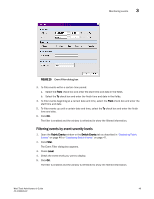
Monitoring events 3 Fabric Events can be collected only for switches that have the same security level (http or https) as the launch switch. For switches with a different level of security from the launch switch, a message at the top of the window indicates how many switches have no events reported from the last polling. 1. Click a fabric in the Fabric Tree. 2. Click Fabric Events in the Monitor area under Tasks. The Fabric Events window opens. FIGURE 23 Fabric Events window You can click the column head to sort the events by a particular column, and drag the column divider to resize a column. You can also right-click a column heading to resize one or all columns, sort the information in ascending or descending order, or choose which columns are displayed. You can also filter events, as described in "Filtering Fabric and Switch Events" on page 48. Displaying Switch Events The Switch Events tab displays a running log of events for the selected switch (see Figure 24 on page 48). Switch events are polled and updated every 15 seconds, so there is no refresh-on-demand option for switch events, as there is for the fabric events. For two-switch configurations, all chassis-related events are displayed in the event list of each logical switch for convenience. 1. Click the switch from the Fabric Tree. The Switch View appears. 2. Click the Switch Events tab, if necessary. Web Tools Administrator's Guide 47 53-1000606-02
-
 1
1 -
2
-
3
-
4
-
5
-
6
-
7
-
8
-
9
-
10
-
11
-
12
-
13
-
14
-
15
-
16
-
17
-
18
-
19
-
20
-
21
-
22
-
23
-
24
-
25
-
26
-
27
-
28
-
29
-
30
-
31
-
32
-
33
-
34
-
35
-
36
-
37
-
38
-
39
-
40
-
41
-
42
-
43
-
44
-
45
-
46
-
47
-
48
-
49
-
50
-
51
-
52
-
53
-
54
-
55
-
56
-
57
-
58
-
59
-
60
-
61
-
 62
62 -
 63
63 -
 64
64 -
 65
65 -
 66
66 -
 67
67 -
 68
68 -
 69
69 -
 70
70 -
 71
71 -
 72
72 -
73
-
74
-
75
-
76
-
77
-
78
-
79
-
80
-
81
-
82
-
83
-
84
-
85
-
86
-
87
-
88
-
89
-
90
-
91
-
92
-
93
-
94
-
95
-
96
-
97
-
98
-
99
-
100
-
101
-
102
-
103
-
104
-
105
-
106
-
107
-
108
-
109
-
110
-
111
-
112
-
113
-
114
-
115
-
116
-
117
-
118
-
119
-
120
-
121
-
122
-
123
-
124
-
125
-
126
-
127
-
128
-
129
-
130
-
131
-
132
-
133
-
134
-
135
-
136
-
137
-
138
-
139
-
140
-
141
-
142
-
143
-
144
-
145
-
146
-
147
-
148
-
149
-
150
-
151
-
152
-
153
-
154
-
155
-
156
-
157
-
158
-
159
-
160
-
161
-
162
-
163
-
164
-
165
-
166
-
167
-
168
-
169
-
170
-
171
-
172
-
173
-
174
-
175
-
176
-
177
-
178
-
179
-
180
-
181
-
182
-
183
-
184
-
185
-
186
-
187
-
188
-
189
-
190
-
191
-
192
-
193
-
194
-
195
-
196
-
197
-
198
-
199
-
200
-
201
-
202
-
203
-
204
-
205
-
206
-
207
-
208
-
209
-
210
-
211
-
212
-
213
-
214
-
215
-
216
-
217
-
218
-
219
-
220
-
221
-
222
-
223
-
224
-
225
-
226
-
227
-
228
-
229
-
230
-
231
-
232
-
233
-
234
-
235
-
236
-
237
-
238
-
239
-
240
-
241
-
242
-
243
-
244
-
245
-
246
-
247
-
248
-
249
-
250
-
251
-
252
-
253
-
254
-
255
-
256
-
257
-
258
-
259
-
260
-
261
-
262
-
263
-
264
-
265
 |
 |