HP Indigo W7250 Strain Gauge Second Transfer Measurement Service and Troublesh - Page 10
Strain Gauge - Interconnection Diagram, Communication path,
 |
View all HP Indigo W7250 manuals
Add to My Manuals
Save this manual to your list of manuals |
Page 10 highlights
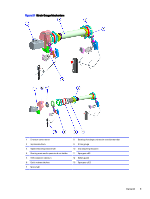
Figure 2-9 Strain Gauge - Interconnection Diagram The communication path is shown below Figure 2-10 Communication path There are two measurement modes: ● Average force at the end of each print cycle (Only during print). ● Continuous measurement (in all states). Average on the measurement window (relative start measurement angle to relative end measurement angle). The strain gauge Input signal ranges from 0 to 4v and then amplified/converts to the amount of force required. The force is calculated using the 0-4v reading and the value of each arm 8 Chapter 2 Introduction
-
 1
1 -
2
-
3
-
4
-
 5
5 -
 6
6 -
 7
7 -
 8
8 -
 9
9 -
 10
10 -
 11
11 -
 12
12 -
 13
13 -
 14
14 -
 15
15
 |
 |

Figure 2-9
Strain Gauge — Interconnection Diagram
The communication path is shown below
Figure 2-10
Communication path
There are two measurement modes:
●
Average force at the end of each print cycle (Only during print).
●
Continuous measurement (in all states).
Average on the measurement window (relative start measurement angle to relative end measurement
angle).
The strain gauge Input signal ranges from 0 to 4v and then amplified/converts to the amount of force
required.
The force is calculated using the 0-4v reading and the value of each arm
8
Chapter 2
Introduction