HP ML150 Optimizing facility operation in high density data center environment - Page 13
Power management and reporting, Comprehensive management applications, Power Capping
 |
UPC - 884420743644
View all HP ML150 manuals
Add to My Manuals
Save this manual to your list of manuals |
Page 13 highlights
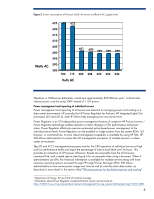
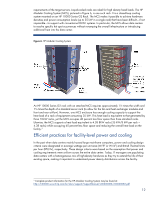
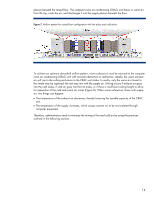
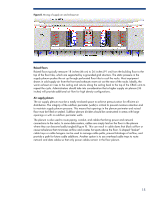
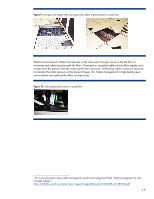
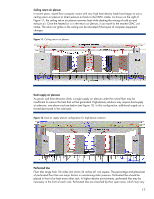
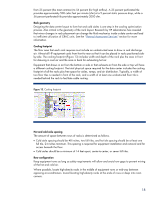
As IT administrators and data center managers are well aware, facility power requirements involve much more than server power requirements. The percentage of total power consumption used by cooling alone in today's average data center can be as high as 70 percent.6 Power management and reporting Management tools that provide graphing and historical analysis of key power and thermal data for servers in the data center can provide a comprehensive overview for facility metrics and management. Comprehensive management applications One tool with these attributes is HP's Insight Power Manager (IPM). Insight Power Manager is a ProLiant Essentials product that is part of HP SIM Graphing. Analysis is supported for single-server or multiple-server views. The IPM product provides graphing and historical analysis of key power and thermal data for supported ProLiant servers and it can store up to three years worth of power and thermal data. Since graphing and analysis is supported for single-server or multiple server views, administrators can estimate power and cooling costs for multiple servers, estimate peak consumption for multiple servers simultaneously, and compare data center temperatures across different parts of the data center. Insight Power Manager also supports changing the Power Regulator mode for one or many ProLiant servers. Power Regulator changes may be made interactively via the web user interface or the changes may be scheduled to occur at specific and recurring times. Power Capping Using updated iLO 2 firmware (version 1.30) and updated System ROM/BIOS (dated 5/1/2007), selected HP ProLiant servers now have the ability to limit the amount of power consumed. Customers may set a limit in watts or Btu/hr. The purpose of this limit is to constrain the amount of power consumed, which reduces the heat output into the data center. The iLO 2 firmware monitors the power consumption of the server, checks it against the power cap goal, and, if necessary, adjusts the server's performance to maintain an average power consumption that is less than or equal to the power cap goal. Using the IPM v1.10 plug-in to Systems Insight Manager v5.1, customers may set power caps on groups of supported servers. The IPM software statically allocates the group power cap among the servers in the group. The group cap is allocated equitably among all servers in the group based on a calculation using each server's idle and maximum measured power consumption. The latest iLO 2 firmware may be found at http://www/hp.com/go/ilo. Updated System ROM/BIOS may be found on the Software and Drivers download page for each server model at www.hp.com/go/proliant. The latest Insight Power Manager software may be found at www.hp.com/go/ipm. Airflow distribution for high-density data centers The front-to-rear airflow through HP equipment allows racks to be arranged in rows front-to-front and back-to-back to form alternating hot and cold aisles. The equipment draws in cold supply air from the front and exhausts warm air out the rear of the rack into hot aisles (Figure 7). Most data centers use a downdraft airflow pattern in which air currents are cooled and heated in a continuous convection cycle. The downdraft airflow pattern requires a raised floor configuration that forms an air supply 6 Sources: Preliminary assessment from Uptime Institute: IDC Data Center of the Future US Server Power Spend for 2005 as a baseline($6bn); applied a cooling factor of 1; applied a .6 multiplier to US data for WW amount; Belady,C., Malone, C.,"Data Center Power Projection to 2014", 2006 ITHERM, San Diego, CA (June 2006) 13
-
 1
1 -
2
-
3
-
4
-
5
-
6
-
7
-
 8
8 -
 9
9 -
 10
10 -
 11
11 -
 12
12 -
 13
13 -
 14
14 -
 15
15 -
 16
16 -
 17
17 -
 18
18 -
19
-
20
-
21
-
22
-
23
-
24
-
25
-
26
 |
 |