HP StorageWorks 8/20q HP StorageWorks 8/20q Fibre Channel Switch command line - Page 42
System process information, Elapsed time between resets, Configuration information
 |
View all HP StorageWorks 8/20q manuals
Add to My Manuals
Save this manual to your list of manuals |
Page 42 highlights
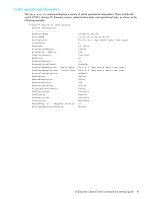
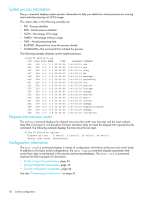
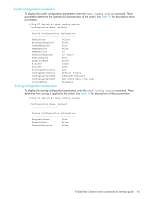
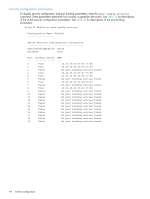
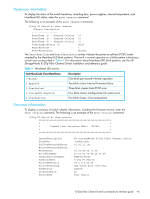
System process information The ps command displays system process information to help you determine what processes are running and central processing unit (CPU) usage. The column titles in the following example are: • PID-Process identifier • PPID-Parent process identifier • %CPU-Percentage CPU usage • %MEM-Percentage memory usage • TIME-Actual processing time • ELAPSED-Elapsed time since the process started • COMMAND-The command that initiated the process. The following example displays current system processes. 8/20q FC Switch #> ps PID PPID %CPU %MEM TIME 244 224 0.0 0.3 00:00:04 245 224 0.0 0.3 00:00:06 246 224 0.0 0.3 00:00:09 247 224 0.0 0.6 00:00:33 248 224 0.3 2.8 00:09:59 249 224 0.0 0.3 00:00:16 251 224 0.0 0.4 00:00:06 252 224 0.0 0.6 00:00:16 253 224 0.0 0.8 00:00:08 254 224 0.0 0.5 00:00:03 255 224 0.0 0.5 00:00:09 256 224 0.0 0.7 00:00:06 257 224 0.0 0.6 00:00:13 282 254 0.0 0.5 00:00:00 284 224 0.0 0.6 00:00:08 285 282 0.0 0.5 00:00:00 308 224 0.0 0.8 00:00:29 Elapsed time between resets ELAPSED COMMAND 2-03:02:31 cns 2-03:02:31 ens 2-03:02:31 dlog 2-03:02:31 ds 2-03:02:31 mgmtApp 2-03:02:31 sys2swlog 2-03:02:30 fc2 2-03:02:30 nserver 2-03:02:30 PortApp 2-03:02:30 qfsApp 2-03:02:30 mserver 2-03:02:30 eport 2-03:02:30 zoning 2-03:02:26 qfsApp 2-03:02:26 snmpservicepath 2-03:02:26 qfsApp 2-03:02:25 cim_server The uptime command displays the elapsed time since the switch was last reset and the reset method. Note that a hot reset or non-disruptive firmware activation does not reset the elapsed time reported by this command. The following example displays the time since the last reset. 8/20q FC Switch #> uptime Elapsed up time : 0 day(s), 2 hour(s), 28 min(s), 44 sec(s) Reason last reset: NormalReset Configuration information The show config command displays a variety of configuration information at the port and switch levels. In addition to the basic switch configurations, the show config command displays parameters that control how data is maintained in the security and zoning databases. The show config command displays the following types of information: • Switch configuration parameters, page 43 • Zoning configuration parameters, page 43 • Security configuration parameters, page 44 See also "Displaying port information" on page 61. 42 Switch configuration
-
 1
1 -
2
-
3
-
4
-
5
-
6
-
7
-
8
-
9
-
10
-
11
-
12
-
13
-
14
-
15
-
16
-
17
-
18
-
19
-
20
-
21
-
22
-
23
-
24
-
25
-
26
-
27
-
28
-
29
-
30
-
31
-
32
-
33
-
34
-
35
-
36
-
 37
37 -
 38
38 -
 39
39 -
 40
40 -
 41
41 -
 42
42 -
 43
43 -
 44
44 -
 45
45 -
 46
46 -
 47
47 -
48
-
49
-
50
-
51
-
52
-
53
-
54
-
55
-
56
-
57
-
58
-
59
-
60
-
61
-
62
-
63
-
64
-
65
-
66
-
67
-
68
-
69
-
70
-
71
-
72
-
73
-
74
-
75
-
76
-
77
-
78
-
79
-
80
-
81
-
82
-
83
-
84
-
85
-
86
-
87
-
88
-
89
-
90
-
91
-
92
-
93
-
94
-
95
-
96
-
97
-
98
-
99
-
100
-
101
-
102
-
103
-
104
-
105
-
106
-
107
-
108
-
109
-
110
-
111
-
112
-
113
-
114
-
115
-
116
-
117
-
118
-
119
-
120
-
121
-
122
-
123
-
124
-
125
-
126
-
127
-
128
-
129
-
130
-
131
-
132
-
133
-
134
-
135
-
136
-
137
-
138
-
139
-
140
-
141
-
142
-
143
-
144
-
145
-
146
-
147
-
148
-
149
-
150
-
151
-
152
-
153
-
154
-
155
-
156
-
157
-
158
-
159
-
160
-
161
-
162
-
163
-
164
-
165
-
166
-
167
-
168
-
169
-
170
-
171
-
172
-
173
-
174
-
175
-
176
-
177
-
178
-
179
-
180
-
181
-
182
-
183
-
184
-
185
-
186
-
187
-
188
-
189
-
190
-
191
-
192
-
193
-
194
-
195
-
196
-
197
-
198
-
199
-
200
-
201
-
202
-
203
-
204
-
205
-
206
-
207
-
208
-
209
-
210
-
211
-
212
-
213
-
214
-
215
-
216
-
217
-
218
-
219
-
220
-
221
-
222
-
223
-
224
-
225
-
226
-
227
-
228
-
229
-
230
-
231
-
232
-
233
-
234
-
235
-
236
-
237
-
238
-
239
-
240
-
241
-
242
-
243
-
244
-
245
-
246
-
247
-
248
-
249
-
250
-
251
-
252
-
253
-
254
-
255
-
256
-
257
-
258
-
259
-
260
-
261
-
262
-
263
-
264
-
265
-
266
-
267
-
268
-
269
-
270
-
271
-
272
-
273
-
274
-
275
-
276
-
277
-
278
-
279
-
280
-
281
-
282
-
283
-
284
-
285
-
286
-
287
-
288
-
289
-
290
-
291
-
292
-
293
-
294
-
295
-
296
-
297
-
298
-
299
-
300
-
301
-
302
-
303
-
304
-
305
-
306
-
307
-
308
-
309
-
310
-
311
-
312
-
313
-
314
-
315
-
316
-
317
-
318
-
319
-
320
-
321
-
322
-
323
-
324
-
325
-
326
-
327
-
328
-
329
-
330
-
331
-
332
 |
 |
