Samsung CLX-4195 Fleet Admin Pro Overview Admin Guide - Page 25
Instant Report, Exporting, Printing, Emailing Instant Report
 |
View all Samsung CLX-4195 manuals
Add to My Manuals
Save this manual to your list of manuals |
Page 25 highlights
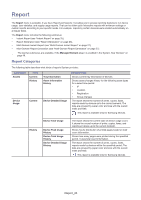
CATEGORY Supply (Device Management Extension plug-in) TYPE Current History Forecast Device Current History Troubles and SLA (Device Management Extension plug-in) Current History Instant Report DESCRIPTION Supply Current Information Shows current consumables status and remaining level configured with supply type, toner type, and state. Supply Lifecycle History Shows statistics for toner changing history including average time and counts. Supply Lifecycle Details Shows toner lifecycle, such as when it was installed, History generated low toner warnings, and more. Supply Details Forecast Shows estimation for when to replace the specified supply type (toner or drum) within a selected period. The number of the needed replacements is provided as well. Supply Forecast Shows estimation for how many selected supply types (toners or drums) should be bought within the specified period. Device List Shows the current device list. Device Lifecycle History Shows the history of devices in the System from discovery to deletion. Device Availability History Shows the downtime history for devices, i.e. how many times devices were unavailable and for how long on average and maximum. Current Troubles Shows current errors on devices by severity level and trouble open time. Trouble Resolution Time by Device Shows how much time which device was working properly based on the time required to fix faults and faults that occur during working time. Trouble Severity Shows the error history for devices configured by severity level and trouble open time. Most Frequent Troubles Shows the errors occurring most frequently on devices. Trouble Resolution Time Shows how long the devices where in error status before being resolved by error type. Trouble Resolution Time Shows how long the devices where in error status before by Severity being resolved by severity type. The Instant Report submenu is available, if you have Instant Report permission. It opens the Instant Report page where you can run on the fly reports designed to help you easily get a quick look at the analytical data related to the devices and device users. You can view reports for a selected device/user group, not individual device(s)/user(s). The Instant Report page consists of: • the left panel where: • Instant Report Type section. It displays a list of reports grouped by categories (e.g. assets, device usage and others). Select the needed report here. See Reports>Instant Report in online help. • Device Groups section. It displays simple device groups, default and created manually. Pick a device group you wish to view a report for. See Device Management>Group Management>Device Group in online help. • Dynamic Groups section. It shows groups the devices are automatically added to according to their properties (e.g. model name, color). Pick a dynamic device group you wish to view a report for. See Device Management>Group Management>Dynamic Group in online help. • the right panel. Its view depends on the selected report and can include: • Settings section. It shows a report parameters (if any). Select the needed parameters here (e.g. report period, supply type, toner type). • Instant Report Results section. It shows the selected report. The report can be represented as a table or a bar/pie chart or both. Depending on the report, you can customize its columns (add, remove, sort) to view the info you wish. Do it the same way as for the Device List. Device Management>Device List> Column Management in online help. For a chart you can hover the cursor over a bar/sector to view details on what it shows. If the Managed Domain plug-in is enabled and several domains are added, the Domain drop-down menu is available in the top left corner. It allows to select a domain you need to run a report for. "Domain" on page 46. Exporting, Printing, Emailing Instant Report Report_25
-
 1
1 -
2
-
3
-
4
-
5
-
6
-
7
-
8
-
9
-
10
-
11
-
12
-
13
-
14
-
15
-
16
-
17
-
18
-
19
-
 20
20 -
 21
21 -
 22
22 -
 23
23 -
 24
24 -
 25
25 -
 26
26 -
 27
27 -
 28
28 -
 29
29 -
 30
30 -
31
-
32
-
33
-
34
-
35
-
36
-
37
-
38
-
39
-
40
-
41
-
42
-
43
-
44
-
45
-
46
-
47
-
48
-
49
-
50
-
51
-
52
-
53
-
54
-
55
-
56
-
57
-
58
-
59
-
60
-
61
-
62
-
63
-
64
-
65
 |
 |
