Cisco AIR-CB21AG-A-K9 Quick Start Guide - Page 12
Visualizing network performance
 |
View all Cisco AIR-CB21AG-A-K9 manuals
Add to My Manuals
Save this manual to your list of manuals |
Page 12 highlights
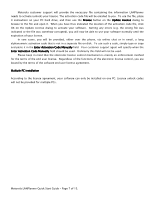
that supports your desired standards. Click in the drawing to indicate the location of your Access Point. You can continue clicking in the drawing if you wish to add more than one Access point. Once you have placed the desired number of Access points, simply right click or press the Esc button. Click Done to exit the 'Place Access Point' dialog box. To edit properties of your Access Points, you can go to Network Design > Edit/Remove Access Point, highlight an Access point and click Edit. The 'Edit Access Point' dialog provides fields for specifying the transmit power, air interface standard, channel, frequency and other characteristics. You can click the Distribution System Editor button in the Edit Virtual Source dialog to add cabling, antennas, and other components to your network. In the resulting Distributed Antenna System dialog, click the Add button to add parts to your network. If you add a cable, you will need to route the cable by clicking in the drawing to indicate its path through the building (right click or hit the Escape key to stop routing cable). If you choose to add an antenna, you'll be able to view the radiation pattern for each antenna in the list of specifications provided with LANPlanner. You can also install connectors, splitters, amplifiers, and other components. When you click OK to exit the Distributed Antenna System editor dialog, and OK again to exit the Edit Access Point dialog, you'll complete the process of installing a virtual Access Point and its associated distribution system in your building model. Visualizing network performance Now that you have equipment placed in your RF Intelligent Model, you can simulate and visualize its expected performance. Select the Network Design > Quick Predict menu command to access the Quick Predict Dialog Box. Select Grid Predictions and click Configure to adjust the grid parameters. Select the Air Interface Standards you wish to model and choose between Forward and Reverse Links. Press Next. Highlight the Access Point(s) you wish to predict for and then click OK. Wait for the software to calculate the simulation results - it shouldn't be a long wait. The result will be a sheet or grid of colored squares draped over your building walls. The color and height of the squares indicates the received signal power at that point in the building. You can hover your mouse pointer over the grid edges to get a tooltip reading of the signal strength. To improve the appearance of the simulation results, choose the View > Shade > Flat Shaded, Edges On menu command, or the View > 3D Views > SW Isometric menu command. Now you can visualize how RF will travel in your deployment environment. For a detailed list of the equipment, cabling and antennas used in your network design plan, use the Utilities > Display Bill of Materials menu command to list the equipment you used. To use the Reporting feature, go to Utilities > Reports. In the Report Configuration dialog window, you see several tabs. Under the Project Overview tab, you can add information about the design project. Next, the Design Summary tab allows you to choose what types of information you wish to include regarding the Access Points. Select the options you wish to have displayed in your report. Finally, under the Predictions tab, you can choose the Air Interface Standard and the type of simulations you wish to have included. Choose at least one of the standards under the Air interface standards. Under Contour Simulations, select 'Include contour simulations' and 'Power (RSSI).' Under Grid Simulations, select 'Include Grid Simulations' and Power (non-composite RSSI). Click the Generate Report button. A Save As window will pop up. Choose an appropriate location for saving the report and make sure to enter a file name. Click Save and wait as the Motorola LANPlanner Quick Start Guide - Page 12 of 15.
-
 1
1 -
2
-
3
-
4
-
5
-
6
-
 7
7 -
 8
8 -
 9
9 -
 10
10 -
 11
11 -
 12
12 -
 13
13 -
 14
14 -
 15
15
 |
 |
