Texas Instruments TI-34 II Teachers Guide - Page 95
Statistics - standard deviation
 |
View all Texas Instruments TI-34 II manuals
Add to My Manuals
Save this manual to your list of manuals |
Page 95 highlights
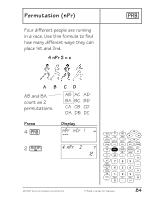
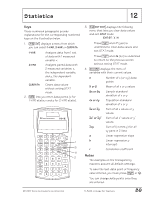
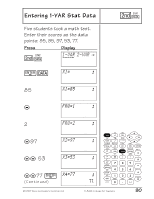
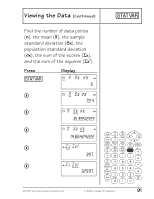
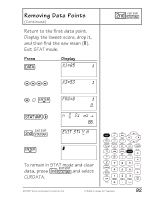
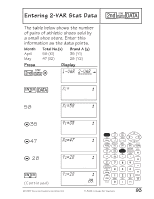
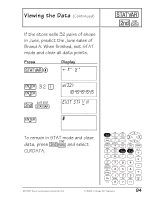
Statistics 12 Keys These numbered paragraphs provide explanations for the corresponding numbered keys on the illustration below. 1. %t displays a menu from which you can select 1-VAR, 2-VAR or CLRDATA. 1-VAR Analyzes data from 1 set of data with 1 measured variable: x. 2-VAR Analyzes paired data with 2 measured variables: x, the independent variable, and y, the dependent variable. CLRDATA Clears data values without exiting STAT mode. 2. v lets you enter data points (x for 1-VAR stats; x and y for 2-VAR stats). 1 3 4 2 3. %w displays the following menu that lets you clear data values and exit STAT mode. EXIT ST: Y N • Press < when Y (yes) is underlined to clear data values and exit STAT mode. • Press < when N (no) is underlined to return to the previous screen without exiting STAT mode. 4. u displays the menu of variables with their current values. n v or w Number of x (or x,y) data points Mean of all x or y values Sx or Sy sx or sy Gx or Gy Gx2 or Gy2 Gxy a Sample standard deviation of x or y Population standard deviation of x or y Sum of all x values or y values Sum of all x2 values or y2 values Sum of (x times y) for all xy pairs in 2 lists Linear regression slope b Linear regression y- intercept r Correlation coefficient Notes • The examples on the transparency masters assume all default settings. • To save the last data point or frequency value entered, you must press < or $. • You can change data points once they are entered. © 1999 TEXAS INSTRUMENTS INCORPORATED TI-34 Û: A Guide for Teachers 89
-
 1
1 -
2
-
3
-
4
-
5
-
6
-
7
-
8
-
9
-
10
-
11
-
12
-
13
-
14
-
15
-
16
-
17
-
18
-
19
-
20
-
21
-
22
-
23
-
24
-
25
-
26
-
27
-
28
-
29
-
30
-
31
-
32
-
33
-
34
-
35
-
36
-
37
-
38
-
39
-
40
-
41
-
42
-
43
-
44
-
45
-
46
-
47
-
48
-
49
-
50
-
51
-
52
-
53
-
54
-
55
-
56
-
57
-
58
-
59
-
60
-
61
-
62
-
63
-
64
-
65
-
66
-
67
-
68
-
69
-
70
-
71
-
72
-
73
-
74
-
75
-
76
-
77
-
78
-
79
-
80
-
81
-
82
-
83
-
84
-
85
-
86
-
87
-
88
-
89
-
 90
90 -
 91
91 -
 92
92 -
 93
93 -
 94
94 -
 95
95 -
 96
96 -
 97
97 -
 98
98 -
 99
99 -
 100
100 -
101
-
102
-
103
-
104
-
105
-
106
-
107
-
108
-
109
-
110
-
111
-
112
-
113
-
114
-
115
-
116
-
117
-
118
-
119
-
120
-
121
-
122
-
123
-
124
-
125
-
126
-
127
-
128
-
129
-
130
-
131
-
132
-
133
-
134
-
135
-
136
-
137
 |
 |